https://dx.doi.org/10.24016/2026.v12.557
ORIGINAL ARTICLE
Development and Psychometric Validation of a Scale Measuring Stigma Toward People with Disabilities in the Adult Population
1 Universidad Peruana Unión, Juliaca, Peru.
2 Universidad Peruana Unión, Lima, Peru.
* Correspondence: berlebriones@upeu.edu.pe
Received: June 28, 2026 | Revised: August 06, 2026 | Accepted: November 02, 2026 | Published Online: November 03, 2026
CITE IT AS:
Callacondo-Quispe, V. S., Marca-Arocutipa, L. A., Ccotohuanca-Condo, J. A., Zela-Mamani, J. L., & Briones-Llamoctanta, B. E. (2026). Development and psychometric validation of a scale measuring stigma toward people with disabilities in the adult population. Interacciones, 12, e557. https://doi.org/10.24016/2026.v12.557
ABSTRACT
Background: Disability stigma can restrict participation and access to opportunities, yet culturally specific measures of public disability stigma remain limited in Peru.
Objective: To develop and evaluate the psychometric properties of a Spanish-language scale assessing public stigma toward persons with disabilities among adults in Juliaca, Peru.
Method: A cross-sectional instrumental study was conducted with a non-probability convenience sample of 1,065 adults from Juliaca, Peru. Six experts assessed content validity using Aiken’s V. The sample was divided into mutually exclusive development (n = 533) and confirmatory (n = 532) subsamples. Exploratory factor analysis used polychoric correlations, MINRES extraction, and Promax rotation; competing confirmatory models were estimated with WLSMV. Internal consistency, average variance extracted (AVE), composite reliability, HTMT, and measurement invariance across sex were examined.
Results: Content validity was strong (Aiken’s V = .96–1.00). Parallel analysis favored two factors, whereas the four-factor exploratory solution showed the strongest relative multidimensional fit and explained 62.6% of the variance. In the confirmatory sample, the empirical four-factor model showed the strongest relative fit, χ²(164) = 902.79, CFI = .935, TLI = .924, RMSEA = .092, SRMR = .051. Reliability was acceptable to good; HTMT indicated limited differentiation between two factors (.924). Metric invariance across sex was supported.
Conclusions: The scale showed promising preliminary psychometric evidence in adults from Juliaca. Further refinement and independent replication are needed before broader application in disability and rehabilitation research.
Keywords: Social Stigma; Persons with Disabilities; Psychometrics; Factor Analysis, Statistical; Rehabilitation.
INTRODUCTION
Disability is increasingly understood not as an attribute located solely within the individual, but as a multidimensional state of functioning that emerges from interactions among health conditions, impairments, activity limitations, participation restrictions, and contextual factors. The World Health Organization’s International Classification of Functioning, Disability and Health (ICF) explicitly incorporates environmental factors into the description of functioning and participation (World Health Organization, 2001). This interactional perspective is consistent with the rights-based approach of the United Nations Convention on the Rights of Persons with Disabilities, which emphasizes autonomy, inclusion, equal participation, and access to health, education, employment, and rehabilitation (United Nations, 2006).
Disability is also a major public health and social equity issue. Approximately 1.3 billion people, or 16% of the global population, experience significant disability, while inequities in health, education, employment, social participation, and access to services remain substantial (World Health Organization, 2022, 2023). These disparities are shaped not only by health conditions or impairments but also by modifiable social and environmental barriers, including ableism, stigma, discrimination, and inaccessible environments. In Peru, the 2017 National Census identified more than three million people with at least one disability, representing approximately 10.4% of the population (Instituto Nacional de Estadística e Informática [INEI], 2019). Recent national monitoring continues to document challenges in educational participation, employment, and economic inclusion (Consejo Nacional para la Integración de la Persona con Discapacidad [CONADIS], 2026).
Stigma provides an important framework for examining these social processes. Goffman (1963) described stigma as social devaluation associated with attributes perceived as discrediting. Link and Phelan (2001) later conceptualized stigma as the co-occurrence of labeling, stereotyping, separation, status loss, and discrimination within contexts in which social power enables these processes. More recent accounts emphasize that stigma is relational and context-dependent rather than an intrinsic characteristic of the stigmatized person (Bos et al., 2013). Applied to disability, this perspective shifts attention from impairment itself to the adverse social judgments and stereotyped expectations attached to disability status.
Carew (2026) further distinguished disability stigma from health stigma using the ICF framework. Whereas health stigma concerns adverse judgments associated with a health condition, disability stigma concerns judgments related to perceived impairments, activity limitations, and/or participation restrictions and may therefore occur independently of a specific diagnosis. In the present study, public disability stigma is understood as the endorsement of devaluing social judgments, stereotyped expectations, and generalized assumptions regarding the capabilities, autonomy, social roles, and participation of persons with disabilities. It is conceptually distinct from experienced discrimination, anticipated stigma, and internalized stigma, although these processes may interact.
This distinction is relevant to rehabilitation and social participation. Disability stigma may contribute to health inequities and barriers to rehabilitation access and service quality (Carew, 2026). Research has also documented how stigma can constrain educational and social inclusion among persons with physical disabilities (Adugna et al., 2025). In addition, recent systematic evidence shows substantial heterogeneity in how disability-related stigma is conceptualized and measured, limiting comparison across studies and evaluation of stigma-reduction interventions (Virendrakumar et al., 2026). These findings support the need for theoretically explicit and psychometrically defensible measures.
Several instruments assess societal responses toward persons with disabilities. The Attitudes to Disability Scale was developed through an international multicentre process (Power et al., 2010), whereas the Multidimensional Attitudes Scale Toward Persons with Disabilities and its adaptations assess affective, cognitive, and behavioral components of attitudes, including a Spanish-language factorial evaluation in Colombian university students (Stevens et al., 2013). Other recent measures have examined multidimensional attitudes in different disability groups and health-related populations (Myong et al., 2021; Park et al., 2023; Heydarian et al., 2025). These instruments are important contributions, but they vary in conceptual scope, target population, disability specificity, and dimensional structure; importantly, measures of general attitudes do not necessarily operationalize public disability stigma as adverse social judgment and stereotype-based devaluation.
This distinction is particularly relevant in Latin America, where culturally appropriate psychometric evidence remains limited. Stevens et al. (2013) provided evidence for a Spanish version of the Multidimensional Attitudes Scale in Colombian university students. More recently, Ruiz Fasabi et al. (2025) developed the 17-item Scale of Attitudes Toward Persons with Disabilities (SAPD) in Peruvian adults, organized around cognitive, affective, and behavioral components. Although this represents an important national contribution, the SAPD was designed to measure attitudes rather than public disability stigma. Evidence therefore remains limited for instruments specifically designed to operationalize public disability stigma in the Peruvian sociocultural context.
Accordingly, the present study sought to develop a Spanish-language scale focused on public stigma toward persons with disabilities and to obtain initial evidence of its psychometric properties among adults in Juliaca, Peru. The initial item pool represented four a priori domains in which devaluing expectations about social functioning may be expressed: economic disadvantage and productivity, dependence and autonomy, family and interpersonal functioning, and work and educational competence. These domains were used as a deductive framework for item generation informed by stigma theory and disability-related participation contexts; they were not assumed to constitute dimensions directly proposed by Goffman. The study examined evidence based on content validity, internal structure, internal consistency, within-model convergent evidence, factor differentiation, and measurement invariance across sex. By distinguishing disability stigma from broader attitudes toward disability, the proposed instrument is intended as a preliminary measure for further psychometric refinement and research on social barriers to participation, rehabilitation, and stigma-reduction interventions.
METHODS
Study design and participants
This instrumental, cross-sectional psychometric study developed and evaluated a Spanish-language measure of public stigma toward persons with disabilities. Scale development followed sequential stages: conceptual specification and item generation, expert-based content evaluation, exploratory factor analysis (EFA) in a development subsample, and confirmatory factor analysis (CFA) in a mutually exclusive validation subsample. Separating exploratory and confirmatory analyses reduced capitalization on sample-specific characteristics and avoided deriving and confirming the factor structure in the same observations (Worthington & Whittaker, 2006; Boateng et al., 2018).
The total sample comprised 1,065 adults residing in Juliaca, Peru, recruited through non-probability convenience sampling via electronic dissemination of the questionnaire. Eligibility criteria were age ≥18 years, residence in Juliaca, voluntary participation, and electronic informed consent. Recruitment was not restricted to university students, occupational groups, patients, or persons with a specific disability or health condition. Sample adequacy was considered in relation to the number of indicators, communalities, factor saturation, and factor overdetermination rather than a fixed participant-to-item ratio (MacCallum et al., 1999). Given the non-probability recruitment, concentration of younger adults, and single-city setting, the sample was not treated as representative of the Peruvian adult population.
Instrument development
The initial instrument contained 20 items developed deductively from literature on stigma, disability, social participation, autonomy, and stereotyped judgments of capability. Four a priori content domains guided item generation: (1) economic disadvantage and productivity, (2) dependence and autonomy, (3) family and interpersonal functioning, and (4) work and educational competence. These domains served as a conceptual framework for item construction and were not assumed to represent an empirically established factor structure.
All items were developed, reviewed, and administered in Spanish. The English wording reported in the manuscript and Supplementary Material is a reporting translation and should not be interpreted as a validated English-language version. Responses were recorded on five ordered categories: 1 (Nunca [Never]), 2 (Casi nunca [Almost never]), 3 (A veces [Sometimes]), 4 (Casi siempre [Almost always]), and 5 (Siempre [Always]). Sixteen items were keyed in the stigma-consistent direction; X5, X10, X13, and X20 were reverse-scored so that higher scores consistently indicated greater endorsement of disability-related stigma. The administered Spanish version, English reporting translation, scoring instructions, and item direction are provided in the Supplementary Material.
Content validity
Six expert judges were purposively selected based on postgraduate training and professional experience in fields relevant to the construct, including clinical, social, educational, and disability-related psychology and educational practice. Independently, they evaluated each item for clarity, relevance, and representativeness and provided qualitative comments on wording, conceptual coverage, and ambiguity.
Content-based evidence was quantified using Aiken’s V with 95% confidence intervals (Aiken, 1985; Penfield & Giacobbi, 2004). Decisions were based jointly on coefficient magnitude and precision, qualitative expert feedback, conceptual relevance, and preservation of construct coverage rather than on a single mechanical cutoff. Recommended wording modifications were implemented before psychometric analyses. Because the panel consisted of professional experts rather than persons with lived experience of disability, the content-validity evidence was interpreted accordingly.
Procedure
Data were collected online using Google Forms. Before participation, individuals received information about the study purpose, procedures, voluntary participation, confidentiality, and the right to discontinue without penalty; only those providing electronic informed consent proceeded to the questionnaire. Data were exported to R for quality control, including checks of response ranges, coding, sociodemographic variables, and item direction.
Statistical analysis
Data partitioning and item-level analyses: Before factor modeling, the total sample was divided into two mutually exclusive and exhaustive subsamples using the parity of the original participant identification number: odd-numbered IDs formed the development sample (n = 533) and even-numbered IDs the confirmatory sample (n = 532). Although deterministic rather than random, this rule was applied to create non-overlapping datasets so that the same observations were not used for both exploratory model development and confirmatory testing. A fixed seed (20260916) was used for stochastic procedures, including parallel analysis.
The development sample was used for item descriptives, factorability assessment, factor-retention decisions, and EFA; the confirmatory sample was used for CFA, reliability, AVE, composite reliability, and HTMT. Item distributions were summarized with means, standard deviations, observed ranges, skewness, and kurtosis. These statistics were treated descriptively rather than as normality-screening criteria because the five-category items were analyzed as ordered categorical indicators.
Exploratory factor analysis: EFA was conducted in the development sample using a polychoric correlation matrix. Factorability was evaluated with the Kaiser–Meyer–Olkin index and Bartlett’s test of sphericity. Factor retention was first examined using ordinal parallel analysis based on 1,000 simulated datasets and the 95th-percentile criterion (Garrido et al., 2013).
Two-, three-, and four-factor solutions were then compared because factor retention was not determined by a single statistic. MINRES was used to estimate common factors from the polychoric matrix, and Promax rotation allowed correlated dimensions. Solutions were evaluated using explained variance, RMSR, RMSEA, TLI, BIC, theoretical interpretability, communalities, primary loadings, cross-loadings, and factorial complexity. Communalities and factorial complexity were examined before interpreting factor loadings; items showing comparatively weak communalities, weak primary loadings, or complex cross-loading patterns were flagged for substantive review rather than automatically deleted. Item retention therefore reflected combined psychometric and theoretical evidence rather than a single numerical criterion (Worthington & Whittaker, 2006). Complete alternative loading matrices are reported in the Supplementary Material.
Confirmatory factor analysis and model comparison: CFA was conducted exclusively in the confirmatory sample using the weighted least squares mean- and variance-adjusted estimator (WLSMV), with all items treated as ordered categorical indicators. WLSMV was selected because robust weighted least-squares estimation is appropriate for ordinal indicators and avoids reliance on the continuous multivariate-normal assumptions of conventional maximum-likelihood estimation (Flora & Curran, 2004; Li, 2016).
Competing models were evaluated: a unidimensional model (M1); a two-factor model separating stigma-oriented from positively worded/reverse-keyed items (M2); the original four-domain model (M4); the empirical four-factor EFA model (M5: EF1 = X11, X14–X19; EF2 = X6–X9, X12; EF3 = X1–X4; EF4 = X5, X10, X13, X20); and a more parsimonious three-factor model combining the two most strongly associated substantive factors (M7). The empirical four- and three-factor models were additionally compared using the appropriate scaled χ² difference test. Second-order and bifactor specifications were examined as sensitivity analyses; inadmissible solutions were not interpreted substantively.
Model evaluation included scaled χ², degrees of freedom, CFI, TLI, RMSEA with its 90% confidence interval, and SRMR. CFI/TLI values near .95, RMSEA near .06, and SRMR below approximately .08 were treated as descriptive reference values rather than rigid cutoffs (Hu & Bentler, 1999), given evidence that their behavior varies across estimators, model structures, sample sizes, and data characteristics (Goretzko et al., 2024; Groskurth et al., 2024). Model selection therefore considered relative fit, standardized parameters, admissibility, theoretical interpretability, and factor differentiation.
Reliability, within-model construct evidence, and sensitivity analyses: For each empirical factor, Cronbach’s α was estimated from observed scores, whereas ordinal α used polychoric correlations and McDonald’s ω used standardized CFA loadings (Gadermann et al., 2012). Average variance extracted (AVE) and composite reliability (CR) were calculated from standardized loadings to describe within-factor convergence (Fornell & Larcker, 1981). Factor differentiation was examined using latent correlations and HTMT based on polychoric correlations; values approaching or exceeding .90 were treated as evidence warranting scrutiny rather than as an automatic deletion rule (Henseler et al., 2015).
Because no independent external stigma or attitude measure was administered, AVE and HTMT were not interpreted as evidence of external convergent, discriminant, criterion, or predictive validity.
Because X20 showed the weakest standardized loading in the empirical CFA model, a sensitivity analysis compared the 20-item solution with an otherwise equivalent 19-item model excluding X20. After model selection in the independent subsamples, the fixed empirical model was re-estimated in the full sample (N = 1,065) solely to obtain more precise standardized parameters and latent correlations. No structural modifications were introduced, and this re-estimation was not treated as an independent confirmation of the factor structure.
Measurement invariance across sex: Measurement invariance was assessed using multigroup CFA for ordered categorical indicators. Configural and metric models were examined following recommendations for categorical CFA (Wu & Estabrook, 2016). Nested models were evaluated using the scaled χ² difference test together with changes in CFI and RMSEA; ΔCFI ≤ .010 and ΔRMSEA ≤ .015 were treated as descriptive indicators of negligible deterioration rather than mechanical decision rules (Chen, 2007).
A nominal scalar specification was also examined; however, scalar invariance was not claimed when that specification failed to impose an identifiable additional set of restrictions beyond the metric model. Consequently, latent mean comparisons were not performed.
Statistical software and reproducibility: All analyses were conducted in R 4.5.3 (R Core Team, 2026) with RStudio. Data management used readxl and dplyr; psych was used for descriptive statistics, polychoric correlations, KMO, Bartlett’s test, EFA, and reliability analyses; GPArotation for oblique rotation; and lavaan for CFA, competing models, standardized solutions, latent correlations, and multigroup analyses, with semTools used where applicable (Rosseel, 2012). The fixed seed 20260916, complete analytical script, and sessionInfo() output were retained to document reproducibility.
Ethical considerations
The study was approved by the Research Ethics Committee of Universidad Peruana Unión (Resolution No. 2025-CEB-FCS-UPeU-No. 005/2026) and was conducted in accordance with the University’s Code of Ethics for Research and applicable ethical requirements for research involving human participants (Universidad Peruana Unión, 2021). Data were used exclusively for scientific and academic purposes under the conditions approved by the committee.
RESULTS
Sociodemographic Analysis
The total sample comprised 1,065 adults residing in Juliaca, Peru. Women represented 58.0% of participants (n = 618) and men 42.0% (n = 447). Mean age was 23.46 years (SD = 4.94; range = 18–39 years), and 53.1% of participants were between 18 and 22 years of age. Most participants were single (80.1%), and incomplete higher education was the most frequently reported educational level (42.7%; Table 1). These characteristics should be considered when interpreting the scope of the psychometric findings.
The sample was partitioned into mutually exclusive development (n = 533) and confirmatory (n = 532) subsamples. Item-level descriptives and exploratory analyses were conducted in the development sample, whereas confirmatory analyses were conducted independently in the confirmatory sample.
Table 1
Participant Characteristics in the Total Sample (N = 1,065)
Characteristic |
Category |
n |
% |
|---|---|---|---|
Sex |
Female |
618 |
58.03 |
Male |
447 |
41.97 |
|
Marital status |
Single |
853 |
80.09 |
Married |
104 |
9.77 |
|
Cohabiting |
87 |
8.17 |
|
Divorced |
15 |
1.41 |
|
Widowed |
6 |
0.56 |
|
Educational attainment |
No formal education |
23 |
2.16 |
Primary |
36 |
3.38 |
|
Secondary |
319 |
29.95 |
|
Incomplete higher education |
455 |
42.72 |
|
Completed higher education |
232 |
21.78 |
|
Age, years |
M |
23.46 |
— |
SD |
4.94 |
— |
|
Range |
18–39 |
— |
Note. Percentages may differ slightly from 100 because of rounding.
Item-level descriptive statistics
All 20 items used the complete five-category response range. In the development sample, item means ranged from 2.84 (X3) to 3.60 (X20), with standard deviations between 0.88 and 1.06. Skewness ranged from −0.33 to 0.08 and kurtosis from −0.38 to 0.24, indicating no marked asymmetry or extreme univariate distributional features. Complete item-level statistics are reported in the Supplementary Material.
The four positively worded items (X5, X10, X13, and X20) were reverse-scored before psychometric analyses. Their item-rest correlations were positive after recoding, ranging from .323 for X20 to .512 for X5. X20 consequently showed the weakest item-level association within this subset and was examined further in sensitivity analyses.
Content validity
Content-based evidence was favorable. Overall Aiken’s V coefficients ranged from .96 to 1.00, whereas coefficients across clarity, relevance, and representativeness ranged from .94 to 1.00. The lower limits of the corresponding 95% confidence intervals ranged from .74 to .82, indicating high point estimates but some variation in precision across evaluations.
Qualitative feedback from the six expert judges resulted primarily in wording refinements intended to increase clarity and precision, including revisions to X4, X15, and X20; no item was eliminated solely on content-validity grounds. Complete item-level Aiken’s V estimates and confidence intervals are provided in the Supplementary Material.
Exploratory factor analysis
Factorability and factor retention: The polychoric correlation matrix showed strong factorability (KMO = .938; item-level KMO = .772–.968), and Bartlett’s test of sphericity was significant, χ²(190) = 7,323.86, p < .001.
Ordinal parallel analysis favored two factors: the first two empirical eigenvalues (10.088 and 1.828) exceeded the corresponding 95th-percentile simulated values (1.467 and 1.377), whereas the third empirical eigenvalue (1.153) did not exceed its simulated value (1.316). However, comparison of exploratory solutions produced non-convergent retention evidence. The four-factor solution explained 62.6% of the variance and showed comparatively better indices (RMSR = .018, RMSEA = .079, TLI = .910, BIC = −223.20) than the two-factor solution (55.1%, RMSR = .037, RMSEA = .112, TLI = .822, BIC = 208.33) and the three-factor solution (59.0%, RMSR = .028, RMSEA = .100, TLI = .856, BIC = 14.10). Accordingly, the four-factor solution was retained as the strongest relative multidimensional representation examined, rather than as a structure uniquely supported by all factor-retention criteria.
Full parallel-analysis results and comparisons among the two-, three-, and four-factor solutions are reported in the Supplementary Material.
Four-factor exploratory structure: Communalities were examined before interpretation of the rotated factor pattern and ranged from .466 to .822. In particular, X13 yielded h² = .474 in the development subsample.
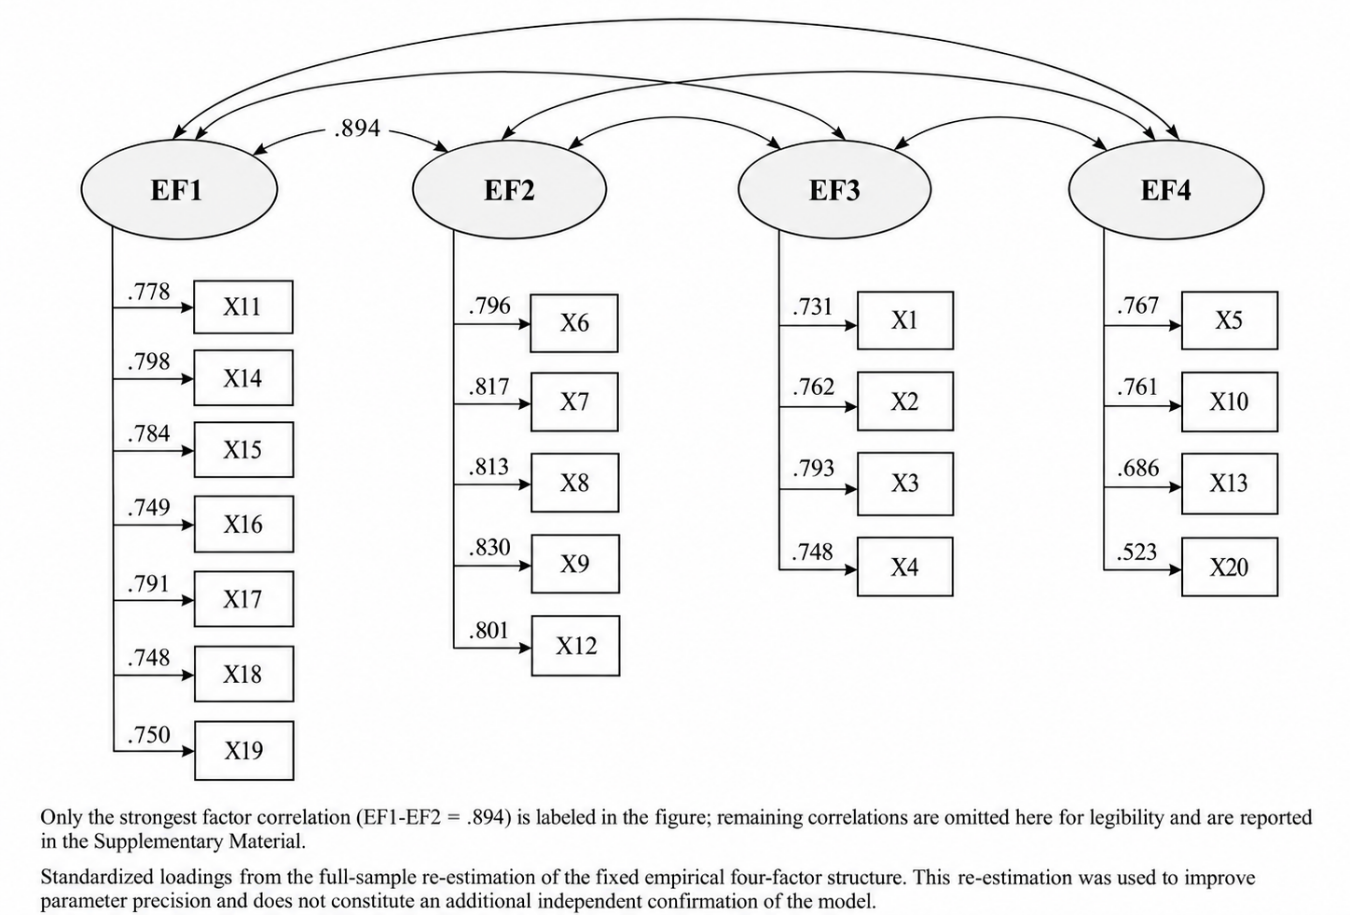
The four-factor solution did not reproduce the four original conceptual domains in a simple manner. For clarity, the empirical factors are designated EF1–EF4. EF1 comprised X11 and X14–X19, EF2 comprised X6–X9 and X12, EF3 comprised X1–X4, and EF4 comprised X5, X10, X13, and X20.
Several items nevertheless displayed secondary loadings or factorial complexity. X3, X9, X12, and X14 showed secondary coefficients ≥ .30. X11 was particularly ambiguous, with essentially equivalent loadings on EF1 (.306) and EF2 (.313) and a complexity value of 3.01. Because this difference was trivial (.007), X11 was treated explicitly as a cross-loading item rather than being reassigned solely on the basis of the largest rounded coefficient; the retained confirmatory specification allocated X11 to EF1. X20 also showed a negative secondary loading on EF2 (−.393) in addition to its primary loading on EF4 (.826).
Table 2
Exploratory Factor Pattern Matrix for the Four-Factor Solution in the Development Sample (n = 533)
Item |
h² |
Complexity |
EF1 |
EF2 |
EF3 |
EF4 |
|---|---|---|---|---|---|---|
X1 |
.547 |
1.169 |
— |
— |
.644 |
— |
X2 |
.624 |
1.004 |
— |
— |
.820 |
— |
X3 |
.681 |
1.877 |
.324 |
— |
.586 |
— |
X4 |
.623 |
1.586 |
— |
— |
.614 |
— |
X5 |
.466 |
1.153 |
— |
— |
— |
.581 |
X6 |
.635 |
1.310 |
— |
.595 |
— |
— |
X7 |
.675 |
1.080 |
— |
.729 |
— |
— |
X8 |
.822 |
1.079 |
— |
.965 |
— |
— |
X9 |
.653 |
1.618 |
.310 |
.568 |
— |
— |
X10 |
.625 |
1.247 |
— |
— |
— |
.752 |
X11 |
.641 |
3.012 |
.306 |
.313 |
— |
— |
X12 |
.648 |
1.761 |
.364 |
.569 |
— |
— |
X13 |
.474 |
1.623 |
— |
— |
— |
.619 |
X14 |
.618 |
1.838 |
.495 |
.362 |
— |
— |
X15 |
.654 |
1.199 |
.610 |
— |
— |
— |
X16 |
.595 |
1.268 |
.680 |
— |
— |
— |
X17 |
.705 |
1.013 |
.835 |
— |
— |
— |
X18 |
.614 |
1.005 |
.787 |
— |
— |
— |
X19 |
.645 |
1.151 |
.697 |
— |
— |
— |
X20 |
.574 |
1.485 |
— |
−.393 |
— |
.826 |
Note. MINRES pattern coefficients after Promax rotation of the polychoric correlation matrix. Coefficients with |λ| < .30 are suppressed to improve readability; the complete unsuppressed matrix is provided in the Supplementary Material. Boldface indicates the loading used for the retained empirical allocation, except X11, which showed essentially equivalent cross-loadings on EF1 and EF2. The corrected correspondence with the original R output is EF1 = MR1, EF2 = MR4, EF3 = MR3, and EF4 = MR2.
Confirmatory factor analysis
Comparison of competing measurement models: Competing specifications were evaluated with WLSMV in the independent confirmatory sample (n = 532). The unidimensional model showed poor fit, as did the original theoretical four-factor model. Separating the four reverse-keyed items into a second factor improved fit but remained insufficient.
The empirical four-factor specification provided the strongest relative fit, scaled χ²(164) = 902.79, CFI = .935, TLI = .924, RMSEA = .092, 90% CI [.086, .098], SRMR = .051. The empirical three-factor alternative showed slightly weaker fit, χ²(167) = 988.61, CFI = .927, TLI = .917, RMSEA = .096, 90% CI [.091, .102], SRMR = .053. The four-factor model also fit significantly better than the three-factor alternative, Δχ²(3) = 76.71, p < .001.
Accordingly, the empirical four-factor model was retained as the principal measurement specification. However, its absolute fit was mixed rather than close: CFI and TLI remained below .95 and RMSEA remained above .08. Selection of this model therefore reflects its superior relative performance among the competing models, not evidence of optimal fit.
Table 3
Confirmatory Fit of Competing Measurement Models in the Confirmatory Sample (n = 532)
Model |
χ² |
df |
CFI |
TLI |
RMSEA [90% CI] |
SRMR |
|---|---|---|---|---|---|---|
One factor |
1767.77 |
170 |
.858 |
.842 |
.133 [.127, .139] |
.075 |
Stigma + keyed-item factor |
1168.36 |
169 |
.911 |
.900 |
.106 [.100, .111] |
.058 |
Four theoretical factors |
1495.27 |
164 |
.882 |
.863 |
.124 [.118, .129] |
.070 |
Four empirical factors |
902.79 |
164 |
.935 |
.924 |
.092 [.086, .098] |
.051 |
Three empirical factors |
988.61 |
167 |
.927 |
.917 |
.096 [.091, .102] |
.053 |
Note. Models were estimated with WLSMV using ordered categorical indicators. Fit indices are interpreted comparatively rather than as mechanical pass/fail criteria. The empirical four-factor model showed the strongest relative fit but did not meet conventional reference values for close fit across all indices.
Standardized parameters and complementary models
Standardized loadings for the retained model in the confirmatory sample ranged from .525 to .831; X20 showed the weakest loading (λ = .525), whereas the remaining indicators were approximately ≥ .68. All loadings differed statistically from zero.
After the model structure had been selected, the same fixed specification was re-estimated in the full sample (N = 1,065) for parameter refinement only. Standardized loadings ranged from .523 to .830, with X20 again showing the weakest loading (λ = .523). The complete standardized solution is provided in the Supplementary Material and represented graphically in Figure 1.
The second-order specification did not yield an admissible primary WLSMV solution and showed poor fit when examined with MLR; the exploratory bifactor model produced an improper solution with negative variance estimates. Because these were complementary analyses, their complete results are reported in the Supplementary Material.
Figure 1
Standardized Solution of the Empirical Four-Factor Measurement Model
Reliability and within-model construct evidence
Internal consistency was satisfactory across the four empirical factors, although estimates were comparatively lower for EF4. McDonald’s ω ranged from .779 to .903, ordinal α from .777 to .901, and conventional α from .739 to .881. Composite reliability exceeded .70 for all factors. AVE was > .50 for EF1–EF3 but was lower for EF4 (.469), indicating weaker within-factor convergence for this dimension.
Factor differentiation was also not uniform. The full-sample latent correlations ranged from .545 to .894, with the strongest association between EF1 and EF2 (r = .894). Consistently, HTMT in the confirmatory sample was .924 for EF1–EF2, whereas the remaining coefficients ranged from .529 to .836. The results therefore do not support a claim of complete discriminant separation across all four factors.
Table 4
Reliability, Within-Factor Convergence, and Factor Differentiation in the Confirmatory Sample (n = 532)
Panel A. Reliability and within-factor convergence |
Panel B. HTMT ratios |
|||||||||
Factor |
Items |
α |
Ordinal α |
ω |
AVE |
CR |
EF1 |
EF2 |
EF3 |
EF4 |
|---|---|---|---|---|---|---|---|---|---|---|
EF1 |
7 |
.881 |
.901 |
.903 |
.573 |
.904 |
— |
|||
EF2 |
5 |
.873 |
.894 |
.902 |
.652 |
.904 |
.924 |
— |
||
EF3 |
4 |
.808 |
.836 |
.840 |
.571 |
.842 |
.832 |
.836 |
— |
|
EF4 |
4 |
.739 |
.777 |
.779 |
.469 |
.776 |
.578 |
.554 |
.529 |
— |
Note. α = Cronbach’s alpha; ω = McDonald’s omega; AVE = average variance extracted; CR = composite reliability; HTMT = heterotrait–monotrait ratio. The EF1–EF2 HTMT coefficient indicates limited empirical differentiation between these two factors. AVE and HTMT are interpreted as within-model evidence and not as substitutes for validity evidence involving external measures.
Sensitivity analysis for X20
Because X20 showed the weakest standardized loading, an otherwise equivalent 19-item model was estimated without this item. The reduced model showed modest improvements in CFI (.941 vs. .935), TLI (.931 vs. .924), and SRMR (.048 vs. .051), whereas RMSEA remained essentially unchanged (.093 vs. .092). The overall structural interpretation therefore did not materially change.
X20 was retained provisionally because its removal produced only modest improvement and because retaining it preserved content representation. Its comparatively weaker performance should nevertheless be reassessed in an independent sample.
Measurement invariance across sex
The configural model showed CFI = .937, TLI = .935, RMSEA = .088, and SRMR = .058. Constraining factor loadings to equality did not deteriorate fit, Δχ²(16) = 18.25, p = .310, ΔCFI = +.004, and ΔRMSEA = −.005, supporting metric invariance across sex.
The subsequent nominal scalar specification yielded the same degrees of freedom and fit indices as the metric model and therefore did not constitute an independently more restrictive test. Consequently, the present results support configural and metric invariance, whereas scalar invariance was not independently established and latent mean comparisons were not performed.
DISCUSSION
The present study developed and evaluated a Spanish-language measure of public stigma toward persons with disabilities among adults in Juliaca, Peru. The findings provide preliminary support for measuring disability-related stigmatizing judgments while also showing that the internal structure is more complex than originally hypothesized. Three issues are particularly relevant: the empirical factors did not reproduce the four a priori domains straightforwardly, one factor coincided with the positively worded/reverse-scored items, and two of the substantive empirical factors showed limited differentiation. Accordingly, the proposed structure should be regarded as provisional and subject to further refinement rather than as a definitive representation of disability stigma.
Interpretation of the empirical structure
The discrepancy between the original conceptual organization and the empirical structure is theoretically informative. The initial domains—economic disadvantage and productivity, dependence and autonomy, family and interpersonal functioning, and work and educational competence—were conceived as contexts in which devaluing social judgments may be expressed, rather than as dimensions explicitly proposed by Goffman. The empirical results suggest that respondents did not distinguish these contexts as sharply as anticipated. In particular, judgments regarding autonomy, family functioning, education, and occupational capability appeared to overlap, potentially reflecting a broader stereotype concerning perceived functional competence.
This pattern is compatible with contemporary conceptualizations of stigma as relational and socially situated rather than reducible to a fixed set of independent domains (Link & Phelan, 2001; Bos et al., 2013). It is also consistent with Carew’s (2026) distinction between disability stigma and health stigma, according to which disability stigma involves adverse judgments related to impairments, activity limitations, and participation restrictions rather than a specific diagnosis. The present findings therefore support retaining a multidimensional conceptual perspective while cautioning against assuming that particular social contexts necessarily constitute psychometrically discrete stigma dimensions.
Factor-retention evidence was similarly non-uniform. Parallel analysis favored two factors, whereas the four-factor exploratory solution showed the strongest relative multidimensional fit and was subsequently superior to competing confirmatory specifications. These findings should not be interpreted as demonstrating that four factors represent the uniquely correct population structure. Rather, they indicate that the four-factor representation provided the most informative organization among the alternatives examined while requiring independent replication.
A particularly important finding was that EF4 comprised exactly the four positively worded items that were reverse-scored before analysis (X5, X10, X13, and X20). This correspondence raises the possibility that EF4 reflects, at least partly, wording-related method variance rather than a fully substantive stigma dimension. Differently keyed items can introduce systematic covariance and complicate dimensional interpretation, particularly when positive and negative formulations differ cognitively or linguistically (Stefana et al., 2025). Therefore, EF4 should not currently be interpreted as an independent substantive domain of public disability stigma. Future versions should test balanced wording, substantively equivalent reformulations, and models explicitly separating wording effects from substantive variance.
The complexity observed for some items reinforces this interpretation. X11 showed essentially equivalent exploratory loadings on EF1 and EF2, while X14 and several additional items exhibited meaningful secondary loadings. Such patterns suggest that some social judgments may span more than one domain and that forcing a simple structure could obscure substantive overlap. Future research using exploratory structural equation modeling or redesigned item pools may clarify whether these cross-loadings represent theoretically meaningful intersections or insufficiently differentiated item content.
Confirmatory evidence and factor differentiation
The independent confirmatory analysis strengthened the evidence for the empirically derived structure relative to the competing specifications, but the absolute fit of the selected model remained mixed. This distinction is important. The four-factor empirical model performed better than the unidimensional, theoretical four-factor, wording-related two-factor, and merged three-factor alternatives, yet CFI and TLI remained below .95 and RMSEA remained above .08. The findings therefore support relative superiority, not close or optimal fit. This cautious interpretation is consistent with current recommendations against treating universal fit-index cutoffs as mechanical pass–fail criteria (Goretzko et al., 2024; Groskurth et al., 2024).
The strongest structural concern involved EF1 and EF2. Their high latent association and HTMT of .924 indicate insufficient differentiation in the present sample. However, merging these factors produced poorer confirmatory fit, suggesting that their relationship cannot be reduced simply to complete redundancy. One plausible interpretation is that they capture closely related expressions of a broader stereotype of capability while retaining some distinct item covariance. Replication with revised indicators is required before deciding whether these factors should remain separate, be combined, or be modeled within a more flexible structural framework.
The hierarchical models did not provide stronger support for a general stigma factor. The second-order specification was not satisfactorily supported under the primary ordinal framework, and the bifactor model produced an inadmissible solution. Consequently, use of a single total score should not yet be assumed to have stronger psychometric justification than factor-level interpretation.
Item performance and reliability
Internal consistency was satisfactory overall, although EF4 showed comparatively weaker performance. Its lower AVE is consistent with the possibility that the factor combines substantive content with wording-related variance. Importantly, AVE and composite reliability provide information about convergence within the measurement model; they should not be interpreted as evidence of external convergent validity.
X20 warrants particular attention. It showed the weakest standardized loading, yet its removal produced only modest changes in global fit. Retaining the item provisionally is therefore defensible because deletion solely to optimize fit could unnecessarily narrow the content domain, particularly given that the item addresses autonomy in educational and career decision-making. Nevertheless, future studies should test a substantively equivalent item written in the same direction as the stigma-oriented items to determine whether its weaker performance reflects wording or content.
The recently developed Peruvian Scale of Attitudes Toward Persons with Disabilities (SAPD) provides a useful point of comparison. That instrument identified cognitive, affective, and behavioral dimensions in 658 Peruvian adults (Ruiz Fasabi et al., 2025). However, the SAPD assesses attitudes, whereas the present scale was intended to capture public disability stigma through devaluing judgments and stereotyped expectations. The differing structures therefore should not be interpreted as conflicting findings; rather, they illustrate that disability-related attitudes and public stigma are conceptually related but non-equivalent constructs. The SAPD study and its sample characteristics are independently documented in the published article.
Measurement invariance
The configural and metric results provide preliminary evidence that the factor-loading pattern operates similarly across women and men in this sample. However, scalar invariance was not independently established because the nominal scalar specification did not impose distinguishable additional constraints beyond the metric model. Latent mean comparisons by sex are therefore not warranted. Future studies should examine threshold invariance using explicitly identified models for ordered categorical indicators before making group comparisons.
Implications for disability and rehabilitation research
Conceptual specificity is important when disability stigma is examined in rehabilitation contexts. Carew (2026) emphasizes that disability stigma should be distinguished from health stigma because adverse judgments associated with activity limitations and participation restrictions may create barriers independently of judgments about a particular health condition. The present scale targets judgments concerning productivity, autonomy, family roles, education, employment, and interpersonal functioning, all of which may be relevant to participation and inclusion.
Research has likewise documented how disability stigma can restrict educational and social participation among persons with physical disabilities. If subsequent studies confirm its structure and external validity, the instrument could contribute to research on attitudinal barriers, participation, rehabilitation, return to education or employment, and stigma-reduction interventions. At its current developmental stage, however, it should be used primarily for research and further psychometric evaluation rather than individual clinical assessment, screening, or decision-making.
Strengths and limitations
The study has several methodological strengths. A relatively large sample was analyzed using procedures appropriate for ordered categorical indicators, including polychoric correlations, ordinal parallel analysis, MINRES, and WLSMV. Most importantly, exploratory and confirmatory analyses were conducted in mutually exclusive subsamples, reducing direct circularity between structure development and confirmation.
Several limitations require consideration. First, participants were recruited through non-probability convenience sampling in a single Peruvian city, and the sample was predominantly composed of younger adults, with a mean age of 23.46 years. Consequently, neither the factor structure nor score distributions should be generalized to the broader Peruvian adult population without replication across older, geographically diverse, and socioeconomically heterogeneous samples.
Second, although the exploratory and confirmatory subsamples were mutually exclusive, allocation was based on participant-ID parity rather than random assignment. If IDs were associated with recruitment order, unmeasured temporal or recruitment-related clustering cannot be completely excluded. Independent external replication therefore remains necessary.
Third, the internal structure was not unequivocal. Parallel analysis favored two factors, the four-factor exploratory solution showed the strongest relative multidimensional performance, the selected CFA model exhibited mixed absolute fit, EF1 and EF2 were insufficiently differentiated, and EF4 coincided with item wording direction. Together, these findings indicate that the current structure remains provisional.
Fourth, the response instructions asked respondents how frequently they agreed with each statement while using frequency anchors ranging from Never to Always. Although administered consistently to all participants, this mismatch between the agreement-oriented prompt and frequency-based response categories may have affected response processes. Future administrations should evaluate response options aligned directly with the judgment requested by the items.
Fifth, no independent measure of disability stigma or theoretically related external construct was administered. Therefore, evidence based on relations with external variables—including convergent, divergent, criterion, predictive, and known-groups evidence—remains unavailable.
Finally, content evaluation relied on professional expert judgment without formal participatory co-design involving persons with lived experience of disability. Future refinement should incorporate cognitive interviews and participatory review with persons with disabilities to evaluate comprehensibility, relevance, and potential unintended interpretations. This is particularly important because statements intended to represent stigmatizing stereotypes should not inadvertently classify accurate recognition of structural or environmental barriers as individual stigma.
Conclusion
The proposed Spanish-language scale provides promising preliminary evidence for assessing public stigma toward persons with disabilities among adults in Juliaca, Peru. The empirical four-factor specification showed the strongest relative performance among the models examined, but the evidence also revealed important structural limitations, including incomplete differentiation between two factors and a fourth factor potentially influenced by item wording. Reliability was generally satisfactory, and metric invariance across sex was supported, but external validity and scalar invariance remain to be established.
Accordingly, the instrument should presently be considered a developing research measure rather than a definitive or clinically applicable scale. Independent replication, refinement of reverse-keyed and cross-loading items, involvement of persons with lived experience of disability, evaluation of aligned response formats, and examination of associations with external measures are necessary before broader application.
ORCID
Victor Saul Callacondo-Quispe: https://orcid.org/0009-0007-0273-1842
Liset Abigail Marca-Arocutipa: https://orcid.org/0009-0000-7309-9548
Jose Antonio Ccotohuanca-Condo: https://orcid.org/0000-0003-2228-7412
Janeth Lidia Zela-Mamani: https://orcid.org/0009-0003-2173-9218
Berle Estalin Briones-Llamoctanta: https://orcid.org/0000-0002-7597-3195
AUTHORS’ CONTRIBUTION
Victor Saul Callacondo-Quispe: Conceptualization, Investigation, Project administration, Writing – Original Draft, Writing – Review & Editing.
Liset Abigail Marca-Arocutipa: Investigation, Data curation, Writing – Original Draft, Writing – Review & Editing.
Jose Antonio Ccotohuanca-Condo: Investigation, Data curation, Writing – Original Draft, Writing – Review & Editing.
Janeth Lidia Zela-Mamani: Methodology, Supervision, Validation, Writing – Review & Editing.
Berle Estalin Briones-Llamoctanta: Methodology, Formal analysis, Validation, Writing – Review & Editing.
FUNDING SOURCE
This research received no specific grant from any funding agency, commercial entity, or non-profit organization.
CONFLICT OF INTEREST
The authors declare that they have no conflicts of interest.
ACKNOWLEDGMENTS
The authors thank the adults who voluntarily participated in this study and the expert judges who contributed to the content validation process of the instrument.
REVIEW PROCESS
This study has been reviewed by two external reviewers in double-blind mode (Franco Tejada-Flores, and Miguel Angel Sainz Palafox). The editor in charge was David Villarreal-Zegarra. The review process is included as supplementary material 1
DATA AVAILABILITY STATEMENT
The anonymized data supporting the findings of this study are available from the corresponding author upon reasonable request, subject to ethical and confidentiality restrictions.
DECLARATION OF THE USE OF GENERATIVE ARTIFICIAL INTELLIGENCE
Generative artificial intelligence tools were used only to support language editing, grammar refinement, and formatting of the manuscript. The authors critically reviewed, edited, and approved the final version of the article and took full responsibility for its content.
DISCLAIMER
The authors are responsible for all statements made in this article.
REFERENCES
Adugna, M. B., Ghahari, S., & Lysaght, R. (2025). Disability stigma and the pursuit of inclusion among children with physical disabilities in northwest Ethiopia. Disability and Rehabilitation, 47(3), 676–686. https://doi.org/10.1080/09638288.2024.2356016.
Aiken, L. R. (1985). Three coefficients for analyzing the reliability and validity of ratings. Educational and Psychological Measurement, 45(1), 131–142. https://doi.org/10.1177/0013164485451012.
Boateng, G. O., Neilands, T. B., Frongillo, E. A., Melgar-Quiñonez, H. R., & Young, S. L. (2018). Best practices for developing and validating scales for health, social, and behavioral research: A primer. Frontiers in Public Health, 6, 149. https://doi.org/10.3389/fpubh.2018.00149.
Bos, A. E. R., Pryor, J. B., Reeder, G. D., & Stutterheim, S. E. (2013). Stigma: Advances in theory and research. Basic and Applied Social Psychology, 35(1), 1–9. https://doi.org/10.1080/01973533.2012.746147.
Carew, M. T. (2026). Separating disability stigma from health stigma: Implications for health and rehabilitation research and practice. Disability and Rehabilitation. Advance online publication. https://doi.org/10.1080/09638288.2026.2652836.
Chen, F. F. (2007). Sensitivity of goodness of fit indexes to lack of measurement invariance. Structural Equation Modeling: A Multidisciplinary Journal, 14(3), 464–504. https://doi.org/10.1080/10705510701301834.
Consejo Nacional para la Integración de la Persona con Discapacidad. (2026). Memoria anual 2025. https://www.gob.pe/institucion/conadis/informes-publicaciones/7991210-memoria-anual-2025
Flora, D. B., & Curran, P. J. (2004). An empirical evaluation of alternative methods of estimation for confirmatory factor analysis with ordinal data. Psychological Methods, 9(4), 466–491. https://doi.org/10.1037/1082-989X.9.4.466.
Fornell, C., & Larcker, D. F. (1981). Evaluating structural equation models with unobservable variables and measurement error. Journal of Marketing Research, 18(1), 39–50. https://doi.org/10.1177/002224378101800104.
Gadermann, A. M., Guhn, M., & Zumbo, B. D. (2012). Estimating ordinal reliability for Likert-type and ordinal item response data: A conceptual, empirical, and practical guide. Practical Assessment, Research & Evaluation, 17(3), 1–13. https://doi.org/10.7275/n560-j767.
Garrido, L. E., Abad, F. J., & Ponsoda, V. (2013). A new look at Horn’s parallel analysis with ordinal variables. Psychological Methods, 18(4), 454–474. https://doi.org/10.1037/a0030005.
Goffman, E. (1963). Stigma: Notes on the management of spoiled identity. Prentice-Hall.
Goretzko, D., Siemund, K., & Sterner, P. (2024). Evaluating model fit of measurement models in confirmatory factor analysis. Educational and Psychological Measurement, 84(1), 123–144. https://doi.org/10.1177/00131644231163813.
Groskurth, K., Bluemke, M., & Lechner, C. M. (2024). Why we need to abandon fixed cutoffs for goodness-of-fit indices: An extensive simulation and possible solutions. Behavior Research Methods, 56(4), 3891–3914. https://doi.org/10.3758/s13428-023-02193-3.
Henseler, J., Ringle, C. M., & Sarstedt, M. (2015). A new criterion for assessing discriminant validity in variance-based structural equation modeling. Journal of the Academy of Marketing Science, 43, 115–135. https://doi.org/10.1007/s11747-014-0403-8.
Heydarian, N. M., Frankowski, S. D., Lee, M., Oh, K. M., An, K., Shin, C., Hughes, A. S., Kartik, R., & Bogart, K. R. (2025). Validating the revised Attitudes Toward People With Disabilities Scale with health care professionals. Rehabilitation Psychology, 70(4), 522–534. https://doi.org/10.1037/rep0000594.
Hu, L.-T., & Bentler, P. M. (1999). Cutoff criteria for fit indexes in covariance structure analysis: Conventional criteria versus new alternatives. Structural Equation Modeling: A Multidisciplinary Journal, 6(1), 1–55. https://doi.org/10.1080/10705519909540118.
Instituto Nacional de Estadística e Informática. (2019). Perfil sociodemográfico de la población con discapacidad, 2017. https://www.inei.gob.pe/media/MenuRecursivo/publicaciones_digitales/Est/Lib1675/libro.pdf
Li, C.-H. (2016). Confirmatory factor analysis with ordinal data: Comparing robust maximum likelihood and diagonally weighted least squares. Behavior Research Methods, 48, 936–949. https://doi.org/10.3758/s13428-015-0619-7.
Link, B. G., & Phelan, J. C. (2001). Conceptualizing stigma. Annual Review of Sociology, 27, 363–385. https://doi.org/10.1146/annurev.soc.27.1.363.
MacCallum, R. C., Widaman, K. F., Zhang, S., & Hong, S. (1999). Sample size in factor analysis. Psychological Methods, 4(1), 84–99. https://doi.org/10.1037/1082-989X.4.1.84.
Myong, Y., Shin, H.-I., Lee, J.-E., Cho, W., & Yi, Y. G. (2021). Development and validation of a new scale to assess attitudes and perspectives toward persons with disabilities. Annals of Rehabilitation Medicine, 45(4), 331–340. https://doi.org/10.5535/arm.21046.
Park, J., Levine, A., Kuo, H. J., Lee, B., & Beymer, P. N. (2023). Validation of the Multiple Disability Multidimensional Attitudes Scale toward persons with disabilities. Rehabilitation Psychology, 68(2), 194–203. https://doi.org/10.1037/rep0000494.
Penfield, R. D., & Giacobbi, P. R., Jr. (2004). Applying a score confidence interval to Aiken’s item content-relevance index. Measurement in Physical Education and Exercise Science, 8(4), 213–225. https://doi.org/10.1207/S15327841MPEE0804_3.
Power, M. J., Green, A. M., & WHOQOL-DIS Group. (2010). The Attitudes to Disability Scale (ADS): Development and psychometric properties. Journal of Intellectual Disability Research, 54(9), 860–874. https://doi.org/10.1111/j.1365-2788.2010.01317.x.
R Core Team. (2026). R: A language and environment for statistical computing (Version 4.5.3) [Computer software]. R Foundation for Statistical Computing. https://www.r-project.org/
Rosseel, Y. (2012). lavaan: An R package for structural equation modeling. Journal of Statistical Software, 48(2), 1–36. https://doi.org/10.18637/jss.v048.i02.
Ruiz Fasabi, E. M., Vargas Caro, F., & Tapullima-Mori, C. (2025). Diseño y validación de la Escala de actitudes hacia las personas con Discapacidad (SAPD) en ciudadanos peruanos. Propósitos y Representaciones, 13, e1938. https://doi.org/10.20511/pyr2025.v13.1938.
Stefana, A., Damiani, S., Granziol, U., Provenzani, U., Solmi, M., Youngstrom, E. A., & Fusar-Poli, P. (2025). Psychological, psychiatric, and behavioral sciences measurement scales: Best practice guidelines for their development and validation. Frontiers in Psychology, 15, 1494261. https://doi.org/10.3389/fpsyg.2024.1494261.
Stevens, L. F., Getachew, M. A., Perrin, P. B., Rivera, D., Olivera Plaza, S. L., & Arango-Lasprilla, J. C. (2013). Factor analysis of the Spanish Multidimensional Attitudes Scale Toward Persons with Disabilities. Rehabilitation Psychology, 58(4), 396–404. https://doi.org/10.1037/a0034064.
United Nations. (2006). Convention on the Rights of Persons with Disabilities (A/RES/61/106).
Universidad Peruana Unión. (2021). Código de Ética para la Investigación (versión 2021). Universidad Peruana Unión.
Virendrakumar, B., Stephen, C., Jolley, E., Pente, V., & Schmidt, E. (2026). Intervention effectiveness reducing disability stigma in sub-Saharan Africa: Systematic review. African Journal of Disability, 15, a1780. https://doi.org/10.4102/ajod.v15i0.1780.
World Health Organization. (2001). International classification of functioning, disability and health: ICF.
World Health Organization. (2022). Global report on health equity for persons with disabilities.
World Health Organization. (2023, March 7). Disability.
Worthington, R. L., & Whittaker, T. A. (2006). Scale development research: A content analysis and recommendations for best practices. The Counseling Psychologist, 34(6), 806–838. https://doi.org/10.1177/0011000006288127.
Wu, H., & Estabrook, R. (2016). Identification of confirmatory factor analysis models of different levels of invariance for ordered categorical outcomes. Psychometrika, 81(4), 1014–1045. https://doi.org/10.1007/s11336-016-9506-0.