https://dx.doi.org/10.24016/2026.v12.514
ORIGINAL ARTICLE
Psychometric properties of the Attitudes toward Indigenous People Scale in university students: Evidence from factorial analysis, psychometric network modeling, and differential item functioning
Julio Cesar Huamani-Cahua1, Yuliana Ordoño Ticona1, Miriam Yisela Viamonte Quispe1, Nanyery Belén Vega Carpio1, Estefany Cecilia Ojeda-Flores2
1 Universidad de San Martín de Porres, Filial Arequipa, Peru.
2 Universidad Continental, Huancayo, Peru.
* Correspondence: 72385459@continental.edu.pe
Received: February 04, 2026 | Revised: March 08, 2026 | Accepted: May 09, 2026 | Published Online: August 19, 2026.
CITE IT AS:
Huamani-Cahua, J. C., Ordoño Ticona, Y., Viamonte Quispe, M. Y., Vega Carpio, N. B., & Ojeda-Flores, E. C. (2026). Psychometric properties of the Attitudes toward Indigenous People Scale in Peruvian university students: Evidence from factorial analysis, psychometric network modeling, and differential item functioning. Interacciones, 12, e514. https://doi.org/10.24016/2026.v12.514
ABSTRACT
Background: Negative attitudes toward Indigenous people remain a persistent expression of prejudice and discrimination in Peru, reinforcing symbolic hierarchies and structural inequities.
Objective: To evaluate the psychometric properties of the Attitudes Toward Indigenous People Scale among Peruvian university students, integrating evidence from content validity, psychometric network analysis, confirmatory factor analysis, measurement invariance, and differential item functioning.
Methods: An instrumental study was conducted with a non-probabilistic sample of 306 university students from Arequipa, Peru. Content validity was assessed using Aiken’s V coefficient with 90% confidence intervals. Item redundancy was examined through Weighted Topological Overlap, and dimensionality was explored using Exploratory Graph Analysis with EBICglasso, the Louvain algorithm, and 1000 bootstrap replications. Confirmatory factor analysis was performed using the WLSMV estimator to compare the original two-factor model with a network-derived unidimensional model. Measurement invariance by sex was tested. Differential item functioning was examined using ordinal regression and likelihood ratio tests with Benjamini–Hochberg correction.
Results: All items showed acceptable content validity and low overall redundancy. Exploratory Graph Analysis supported a stable unidimensional structure, with all items consistently assigned to a single community across bootstrap replications. The original two-factor model showed better global fit than the unidimensional model (CFI = .976; TLI = .968; SRMR = .032; RMSEA = .082), although the correlation between factors was very high (r = .929), indicating substantial overlap and limited discriminant validity. The unidimensional model also showed adequate fit in incremental and residual indices (CFI = .963; TLI = .952; SRMR = .036), strong internal consistency (ω = .923; α = .924), and acceptable convergent validity. Measurement invariance by sex was supported up to the strict level. Uniform differential item functioning was identified in two items, suggesting localized sex-related response bias, whereas no non-uniform DIF was observed.
Conclusion: The Attitudes Toward Indigenous People Scale showed adequate evidence of validity and reliability in Peruvian university students. Although the original two-factor model demonstrated superior statistical fit, the high interfactor correlation and network evidence support a parsimonious unidimensional interpretation.
Keywords: Attitudes toward Indigenous people; psychometric validation; exploratory graph analysis; confirmatory factor analysis; differential item functioning.
INTRODUCTION
The cultural and social diversity of a country should translate into a greater richness of knowledge, practices, and cultural expressions, constituting a foundation for the recognition of diverse identities and the construction of a collective sense of belonging (Pumacahua & Zeballos, 2022). However, in the Peruvian context, these differences have tended to be organized into processes of separation and symbolic hierarchization which, being embedded in social discourse, are often assumed to be natural and therefore rarely questioned critically (Lovón Cueva & Palomino Gonzales, 2022).
In this context, the Indigenous population has historically been positioned in socially hierarchical inferior statuses through persistent prejudices and discriminatory practices, which shape how they are perceived and treated in public spaces and restrict their access to resources and rights, thereby reproducing social and cultural inequalities (Pumacahua & Zeballos, 2022; Celigueta & Viola, 2021; Viola Recasens, 2020).
Social hierarchization based on prejudice and discriminatory practices can be understood through the concept of discrimination, defined as a set of practices and attitudes oriented toward the contempt of individuals perceived as inferior due to their difference, which frequently translates into the restriction or denial of fundamental rights (Lovón Cueva & Palomino Gonzales, 2022). Although many Peruvians do not openly define themselves as discriminatory nor explicitly employ ethnic-racial categories, social prejudices manifest indirectly through socially accepted criteria, such as social class, type of education, family reputation, beauty standards associated with skin color, ways of speaking Spanish, styles of dress, and residential location (Lovón Cueva & Palomino Gonzales, 2022; Ministerio de Cultura, 2018).
Discrimination can also be understood through historically consolidated cognitive schemas formed during the processes of colonization in Latin America, which established social hierarchies that positioned conquering groups and their physical and cultural characteristics as superior, generating the systematic subordination of Indigenous peoples (Alcota & Rebolledo-Huenuil, 2025). In the Peruvian case, these hierarchies are expressed through differentiated valuations across regions, where the Andean population has been socially devalued in relation to the coastal population, regardless of individual social and economic trajectories (Lovón Cueva & Palomino Gonzales, 2022).
In this way, negative stereotypes about Indigenous peoples operate as a phenomenon transversal to the functioning of society, becoming embedded in everyday habits and practices without necessarily involving awareness or explicit recognition of the social positioning that is adopted (de Veintimilla, 2024; Lovón Cueva & Palomino Gonzales, 2022). This process facilitates the naturalization of prejudices and the stigmatization of certain traits associated with specific populations, reproducing asymmetric interaction patterns that are socially learned and reinforced, both consciously and unconsciously (Celigueta & Viola, 2021; Lovón Cueva & Palomino Gonzales, 2022).
Even though the Peruvian legal framework recognizes and sanctions discrimination, these provisions have not succeeded in substantially modifying the persistence of prejudice in everyday social life (Lovón Cueva & Palomino Gonzales, 2022; Indecopi, 2015). This is because such prejudices are widely naturalized and are recurrently expressed in colloquial language with derogatory terms such as cholo, serrano, or indio, associated with a presumed Indigenous origin (Romero, 2022; de Veintimilla, 2024). These terms are often linked to negative evaluations regarding intellectual capacity, morality, hygiene, physical appearance, poverty, or health status, without any evidence supporting such attributions (Pumacahua & Zeballos, 2022; Romero, 2022; de Veintimilla, 2024).
These schemas manifest concretely across different institutional settings, particularly in the school environment through bullying practices associated with phenotypical characteristics and ways of speaking; in the health sector, through attitudes of superiority and dismissive judgments by professionals; and in public authority, especially in interactions with the police, where expressions of devaluation linked to ethnic origin and perceived educational level persist (Celigueta & Viola, 2021; de Veintimilla, 2024).
The magnitude and persistence of these manifestations are evidenced in the results of the Survey of Perceptions and Attitudes on Cultural Diversity and Ethnic-Racial Discrimination, administered to 3,781 individuals aged 18 to 70 nationwide, which shows that more than half of the Peruvian population has experienced some degree of discrimination (Ministerio de Cultura, 2018). Among the main reported reasons are those associated with Andean traits, such as skin color, physical features, place of origin, and way of speaking. Likewise, 53% of respondents consider Peruvian society to be racist or very racist, and 57% perceive that the Indigenous population is discriminated against or highly discriminated against, confirming the persistence of these practices across different domains of social life, including formal and institutional settings (Ministerio de Cultura, 2018).
Discrimination is not limited to individual effects, such as psychological harm or experiences of unequal treatment, but is also associated with structural consequences that directly affect the living conditions of discriminated populations. Ethnic and cultural inequalities contribute to widening gaps in well-being, restrict the effective exercise of rights, and limit social opportunities, consolidating processes of exclusion and persistent disadvantage (Comisión Económica para América Latina y el Caribe [CEPAL], 2016; de Veintimilla, 2024). In this context, Indigenous peoples and impoverished sectors exhibit greater vulnerability to social and health-related risks, highlighting that discrimination operates as a factor that increases exposure to illness, precarizes access to services, and perpetuates conditions of inequality across the life course and between generations (Alcota & Rebolledo-Huenuil, 2025; de Veintimilla, 2024).
In this regard, it is pertinent to have instruments that allow for the rigorous assessment of attitudes toward Indigenous people. According to González-Fócil (2016), attitudes are understood as learned psychological predispositions theoretically composed of three components: the cognitive, referring to conscious ideas, beliefs, and thoughts about the attitudinal object; the affective, related to the feelings, emotions, and evaluative reactions it elicits; and the behavioral, encompassing the actions or behavioral intentions directed toward it. From this perspective, the Attitudes Toward Indigenous People Scale was designed to measure negative dispositions expressed through prejudice and discriminatory practices in social interaction, through a multidimensional structure composed of two factors: Contact and Stereotypes, which assesses prejudicial attitudes based on traditional stereotypes and avoidance of contact with Indigenous people; and Intolerance and Inequity, which captures attitudes of intransigence and discrimination expressed through unequal treatment toward this population group.
Currently, few scales are specifically designed to assess attitudes toward Indigenous people. In the international context, one of the earliest references corresponds to the study conducted in Australia by Pedersen et al. (2004), who developed the Attitudes Toward Indigenous Australians Scale (ATIA), an 18-item instrument intended to assess negative attitudes toward the Australian Indigenous population, integrating both overt and subtle expressions of prejudice and rejection.
In the Latin American context, various instruments have been developed and adapted that address constructs conceptually related, though not equivalent to attitudes toward Indigenous people. In Mexico, Echeverría Echeverría and Flores Galaz (2013) assessed positive and negative stereotypical beliefs toward Indigenous people among university students using a 50-item scale organized into five dimensions. In Chile, Cárdenas (2007) adapted McConahay et al.’s (1981) Modern Racism Scale, as well as Pettigrew and Meertens’ (1995) Subtle and Blatant Prejudice Scales, which focus on measuring racism rather than specific attitudes toward Indigenous people. Similarly, in Argentina, these latter scales were adapted to assess dimensions such as threat, rejection, traditional values, and cultural differences.
These studies demonstrate relevant advances in the measurement of prejudice and related constructs; however, they differ in their conceptual and structural approach from the Attitudes Toward Indigenous People Scale, which is specifically oriented toward assessing attitudes expressed through stereotypes, avoidance of contact, intolerance, and inequity.
For the present study, the integration of Exploratory Graph Analysis (EGA) and Confirmatory Factor Analysis (CFA) constitutes a complementary strategy to more robustly evaluate the internal structure of the instrument. CFA allows for the testing of predefined theoretical models through global fit indices and parsimony criteria (Brown, 2015), whereas EGA empirically estimates dimensionality based on partial correlation networks without imposing a prior structure (Golino et al., 2020). Thus, EGA exploratorily identifies the natural organization of items and potential dimensional communities, while CFA confirms or contrasts this structure under specific theoretical assumptions. Both methods provide a more robust assessment of the latent structure, reduce the risk of model misspecification, and expand psychometric understanding beyond what traditional SEM alone can offer.
Therefore, it is both pertinent and necessary to have a scale that allows the assessment of attitudes toward Indigenous people in Peru, considering the country’s sociocultural particularities and the complexity of the phenomenon described. Unlike instruments developed in other contexts, the present study aims to examine the psychometric properties of the Attitudes Toward Indigenous People Scale using rigorous and complementary analytical procedures, including confirmatory factor analysis, psychometric network models, and differential item functioning assessment, with the objective of providing solid evidence regarding its structure, functioning, and validity in the Peruvian population. In this sense, the research hypothesis is proposed that the Attitudes Toward Indigenous People Scale will show adequate psychometric properties, including a valid internal structure, adequate levels of reliability, and measurement equivalence across sexes.
METHODS
Design
The study employed an instrumental design (Ato et al., 2013), aimed at evaluating the psychometric properties of the Attitudes Toward Indigenous People Scale in Peruvian university students.
Participants
The sample was non-probabilistic by convenience, composed of 306 university students, 53.9% female and 46.1% male, age (M = 20.18, SD = 2.3). For the sample, the calculator proposed by Arifin (2025) for structural equation models was used. The following were considered: expected CFI = 0.95, average factor loading = 0.60, significance level (α) = 0.05, and statistical power = 0.80. For a two-dimensional model of ten items (dimension 1: 7 items and dimension 2: 3 items) and an expected attrition rate of 10%, the minimum required sample size was n = 293. The inclusion criteria considered were students over 18 years of age, from a private university in Arequipa, of both sexes.
Instrument
The Attitudes Toward Indigenous People Scale was developed by González-Fócil (2016), and measures attitudes toward Indigenous people in students and health professionals. The scale was designed to be applied in students of health-related programs and to health professionals, the population in which its original validation was carried out. It consists of 10 items, with each item answered on a five-point Likert scale (Strongly disagree = 1 to Strongly agree = 5). It has two factors: Contact and stereotypes: This factor measures prejudicial attitudes toward Indigenous people based on traditional stereotypes, as well as rejection of having any type of relationship with them (7 items); and Intolerance and inequity: This aspect measures attitudes of intransigence and discrimination toward Indigenous people (3 items). The original instrument was validated using EFA, through an orthogonal two-factor rotation, an explained variance of 52.14%, KMO = 0.88, and factor loadings greater than 0.50. Reliability was calculated using Cronbach’s alpha coefficient (factor 1 = 0.82; factor 2 = 0.56).
The score of the instrument is obtained by summing the items in each dimension. In both factors, higher values indicate more negative attitudes toward Indigenous people. The Contact and Stereotypes factor has a range of 7 to 35 points, while Intolerance and Inequity range from 3 to 15 points. Likewise, a total score can be calculated that ranges from 10 to 50 points.
With the purpose of illustrating the content of the evaluated dimensions, examples of items are included. In the Contact and Stereotypes factor, items such as: “I would feel uncomfortable being seen in public with Indigenous people” and “I prefer not to shake hands with Indigenous people” are considered. For its part, in the Intolerance and Inequity factor, items such as: “Indigenous people are very overfamiliar” and “Indigenous people should not frequent certain places” are included. These examples make it possible to evidence the type of attitudes evaluated in each dimension.
Procedures
Prior to data collection, a formal request was submitted to the university institution, specifying the objective of the study, the persons responsible for the research, the description of the instrument, and the estimated time of administration. After institutional authorization, the instrument was administered virtually via Google Forms within the university setting. Participation was voluntary, and informed consent was obtained from all participants, ensuring confidentiality and the exclusive use of the information for scientific purposes, in accordance with the ethical principles established in the corresponding section of the manuscript.
Data analysis
Jamovi software (The jamovi project, 2024) and the R programming language in its RStudio environment (Posit team, 2023) were used to perform data analysis.
Content validity and descriptive item analysis: In a preliminary phase, the content validity of the Attitudes toward Indigenous People Scale was evaluated using Aiken’s V coefficient, with the participation of four expert judges. in which each item was analyzed based on three criteria: relevance, coherence, and clarity. For this purpose, a four-point ordinal scale was used, where 1 indicates that the item does not meet the criterion, 2 reflects a low level, 3 a moderate level, and 4 a high level of compliance. The judges were selected based on their experience and training in the field, including professionals in social psychology and sociology, which ensured a multidisciplinary evaluation of the instrument. Given that the instrument was adapted, 90% confidence intervals and the flexible criterion proposed by Merino-Soto & Livia-Segovia (2009) were used, considering as a cutoff point a lower limit greater than .50. Likewise, data cleaning and descriptive item analysis were conducted, calculating mean, standard deviation, skewness, kurtosis, corrected item–test correlation, and percentage distribution of responses. Given the ordinal nature of the items, strict normality was not assumed for subsequent analyses (Li, 2016).
Exploratory structural analysis using psychometric networks: Item redundancy was evaluated through Unique Variable Analysis (UVA), using the Weighted Topological Overlap (wTO) coefficient. According to the criteria of Christensen et al. (2023), pairs with wTO values > .20 were considered redundant, distinguishing levels of low to moderate redundancy (.20–.25), moderate to high (.25–.30), and high (> .30).
Subsequently, the internal structure of the instrument was examined using Exploratory Graph Analysis (EGA), implemented with the EGAnet package (Golino & Christensen, 2025). The network was estimated from a correlation matrix obtained using cor_auto, an automatic correlation-selection procedure implemented in qgraph that allows the use of estimators appropriate for ordinal data. This approach is consistent with methodological recommendations for network analysis with ordered categorical variables (Isvoranu & Epskamp, 2023). The network model was estimated to use the EBICglasso algorithm with a penalization parameter of γ = .50 (Foygel & Drton, 2010), and dimensionality detection was performed using the Louvain algorithm (Christensen, 2020; Traag et al., 2019).
The stability of the model was evaluated using Bootstrap EGA (1000 replications) employing the bootEGA function from the EGAnet library (Golino & Christensen, 2025). Item stability was estimated based on the proportion of replications in which each node remained assigned to the same dimension, with values ≥ .75 considered adequate evidence of structural stability (Christensen & Golino, 2021).
Subsequently, structural invariance of the network was evaluated by sex using the Network Comparison Test (NCT), examining potential differences in edge weights and in the global graph structure (Jamison et al., 2024). To control Type I error due to multiple comparisons, the Benjamini–Hochberg (1995) correction was applied, allowing determination of the stability of network organization and connectivity across subgroups (Epskamp et al., 2018).
Confirmatory factor analysis (CFA) and factorial invariance across groups: In the confirmatory phase and based on the unidimensional structure suggested by the EGA and the theoretical model (two dimensions), a Confirmatory Factor Analysis (CFA) was conducted using the lavaan package with the WLSMV estimator, appropriate for ordinal variables (Brown, 2015; Kline, 2015). Model fit was evaluated using the χ²/df, CFI, TLI, RMSEA with confidence interval, and SRMR indices, considering adequate fit criteria of CFI and TLI ≥ .95, and RMSEA and SRMR ≤ .08 (Brown, 2015; Pavlov et al., 2021).
Internal consistency was evaluated using McDonald’s omega coefficient (ω), considering values above .70 as adequate (Hayes & Coutts, 2020; McDonald, 1999). Convergent validity was examined through the Average Variance Extracted (AVE), adopting values ≥ .50 as the criterion (Fornell & Larcker, 1981), along with standardized factor loadings greater than .50 (Johnson & Stevens, 2001).
Measurement invariance by sex was evaluated using Multigroup Confirmatory Factor Analysis (MG-CFA), considering nested models of configural, metric, scalar, and strict invariance. Invariance acceptance was based on changes between models lower than ΔCFI < .01, ΔTLI < .01, ΔRMSEA < .015, and ΔSRMR < .030 (Chen, 2007; Putnick & Bornstein, 2016).
Differential Item Functioning (DIF) analysis: DIF was evaluated using an ordinal regression approach with the SnowIRT module in jamovi (The jamovi project, 2024). Both uniform and non-uniform DIF (Magis et al., 2010) were analyzed using likelihood ratio tests (Zumbo, 1999), and p-values were adjusted using the Benjamini–Hochberg (BH-p) procedure to control Type I error due to multiple comparisons. The presence of DIF was determined based on non-substantive changes in model fit and adjusted values greater than .05 (Benjamini & Hochberg, 1995). In this context, it is important to note that the evaluation was based on likelihood ratio tests (χ²), which allow detecting the existence of bias, but do not directly estimate its magnitude.
Ethical aspects
This study was exempt from review and approval by an Ethics Committee, as determined by the Research Unit of the Universidad de San Martín de Porres, Southern Branch, through the Certificate of Exemption from Ethics Committee Review issued on January 29, 2026. Given the non-interventional nature of the study and the anonymous and voluntary collection of data, no ethics approval code was assigned. All participants provided written informed consent prior to participation, and the confidentiality and scientific use of the collected information were guaranteed
RESULTS
Content validity and descriptive item analysis
The content validity of the Attitudes toward Indigenous People Scale was evaluated using Aiken’s V with four expert judges, employing 90% confidence intervals and the flexible criterion (LI > .50) proposed by Merino-Soto and Livia-Segovia (2009), due to the adaptation of the instrument. All 10 items reached acceptable values; therefore, none were rejected. Although statistically all items were accepted, eight of them were reformulated with the purpose of improving semantic precision, level of formality, conceptual clarity, and ethical adequacy of language, avoiding colloquial, ambiguous, or potentially stigmatizing expressions, and expanding their applicability to social and educational contexts. These modifications allowed the evaluative meaning of the items to be preserved, while optimizing their comprehensibility and cultural relevance; that is, in specific terms, the modifications included the replacement of restrictive expressions with broader formulations (e.g., “clients or patients” with “interact with or study”), the contextualization of behaviors to avoid absolute generalizations (e.g., reference to “public spaces”), and the elimination of fillers or colloquial terms that affected the objectivity of the statement. Likewise, words with derogatory or stigmatizing connotations (e.g., “races,” “lazy,” “overfamiliar”) were replaced with more neutral and formal expressions, maintaining the evaluative content of the item within an ethically appropriate framework. Finally, lexical adjustments were made to increase semantic precision and reduce interpretative ambiguities (e.g., “frequent” replaced by “attend”) (Table 1).
Table 1. Content validity by expert judgment
|
Items |
Judge_1 |
Judge_2 |
Judge_3 |
Judge_4 |
Mean |
Aiken’s V |
90% IC |
Rating |
|
|
|
|
|
|
|
|
|
Lower limit. |
Upper limit. |
|
|
pi_1 |
3.7 |
4.0 |
4.0 |
3.0 |
3.7 |
0.90 |
0.68 |
0.98 |
Accepted |
|
pi_2 |
3.7 |
4.0 |
3.7 |
3.0 |
3.6 |
0.87 |
0.64 |
0.96 |
Accepted |
|
pi_3 |
4.0 |
4.0 |
3.3 |
4.0 |
3.8 |
0.93 |
0.72 |
0.99 |
Accepted |
|
pi_4 |
3.7 |
4.0 |
3.7 |
4.0 |
3.9 |
0.97 |
0.77 |
1.00 |
Accepted |
|
pi_5 |
3.3 |
3.0 |
3.7 |
3.0 |
3.2 |
0.73 |
0.50 |
0.89 |
Accepted |
|
pi_6 |
3.3 |
3.7 |
3.3 |
3.0 |
3.3 |
0.77 |
0.53 |
0.91 |
Accepted |
|
pi_7 |
3.7 |
4.0 |
3.7 |
3.0 |
3.6 |
0.87 |
0.64 |
0.96 |
Accepted |
|
pi_8 |
2.7 |
3.3 |
3.7 |
3.7 |
3.6 |
0.87 |
0.64 |
0.96 |
Accepted |
|
pi_9 |
4.0 |
4.0 |
3.7 |
4.0 |
3.9 |
0.97 |
0.77 |
1.00 |
Accepted |
|
pi_10 |
4.0 |
4.0 |
3.3 |
3.3 |
3.6 |
0.87 |
0.64 |
0.96 |
Accepted |
Note. V = Aiken’s V; Lim. inf. = Lower limit; Lim. Sup. = Upper limit; CI = Confidence intervals
In Table 2, it is observed that all items present adequate variances (σ > 1.15), evidencing sufficient dispersion and absence of range restriction. Skewness and kurtosis values are within acceptable limits < 1.5, indicating a normal distribution of the data. Likewise, corrected item–test correlations ranged from .478 to .824, confirming adequate discrimination and internal consistency of all items. In addition, the distribution of response categories shows that, across all items, the options Totally disagree (TD) and Disagree (D) predominate, indicating that prejudicial attitudes toward Indigenous people are not evidenced.
Table 2. Descriptive analysis of the items.
|
Item |
M |
σ |
g1 |
g2 |
cit |
TD |
D |
I |
A |
TA |
|
pi_1 |
2.33 |
1.65 |
0.58 |
-0.70 |
0.48 |
37.6% |
17.3% |
28.4% |
8.2% |
8.5% |
|
pi_2 |
2.27 |
1.32 |
0.53 |
-0.63 |
0.65 |
33.0% |
26.1% |
25.5% |
11.4% |
3.9% |
|
pi_3 |
1.79 |
1.24 |
1.40 |
1.14 |
0.81 |
56.9% |
20.6% |
13.7% |
4.2% |
4.6% |
|
pi_4 |
1.76 |
1.18 |
1.49 |
1.56 |
0.79 |
56.9% |
22.2% |
13.4% |
2.9% |
4.6% |
|
pi_5 |
1.82 |
1.23 |
1.28 |
0.83 |
0.82 |
55.2% |
19.6% |
17.0% |
3.9% |
4.2% |
|
pi_6 |
1.82 |
1.15 |
1.25 |
0.87 |
0.82 |
53.9% |
21.2% |
17.6% |
3.6% |
3.6% |
|
pi_7 |
1.88 |
1.33 |
1.23 |
0.55 |
0.76 |
52.6% |
22.9% |
13.1% |
6.9% |
4.6% |
|
pi_8 |
2.55 |
1.54 |
0.29 |
-0.86 |
0.57 |
27.5% |
19.3% |
32.0% |
13.4% |
7.8% |
|
pi_9 |
1.91 |
1.27 |
1.13 |
0.51 |
0.77 |
50.3% |
21.9% |
19.0% |
4.2% |
4.6% |
|
pi_10 |
2.00 |
1.33 |
0.94 |
0.06 |
0.70 |
47.4% |
19.3% |
24.2% |
4.2% |
4.9% |
Note. M = arithmetic mean; σ = variance; g1 = skewness; g2 = kurtosis; cit = item–test correlation; TD = Totally disagree; D = Disagree; I = Indifferent; A = Agree; TA = Totally agree
Exploratory structural analysis using psychometric networks
In our study only three pairs of items present relevant structural overlap. The pi_3 and pi_4 pair exhibits moderate-to-high redundancy (wTO = .281), indicating that both items largely share the same patterns of relationships with the rest of the scale and may be measuring partially overlapping content. The pi_4 and pi_5 (wTO = .210) and pi_3 and pi_5 (wTO = .207) pairs present small to moderate redundancy, suggesting slight overlap. Overall, the scale shows low global redundancy.
To evaluate the dimensional structure of the scale, the GLASSO model with EBIC selection (γ = 0.5) was applied. The optimal regularization parameter of the model was λ = 0.0878, estimated from 100 values (ratio = 0.10). Automatic correlation for ordinal data (cor_auto) was used, obtaining TEFI = 0, which indicates an optimal dimensional solution. The estimated network consisted of 10 nodes and showed a unidimensional structure, with stronger associations concentrated in the core pi_3, pi_4, pi_5 (Figure 1), which supports the structural coherence of the scale.
Stability analysis using Bootstrap EGA shows that all items (pi_1 to pi_10) replicate in a single community with probability 1.00, which evidences perfect structural stability of the unidimensional solution. This result confirms that the identified dimensional structure is highly robust and reliable, supporting the internal coherence of the scale.
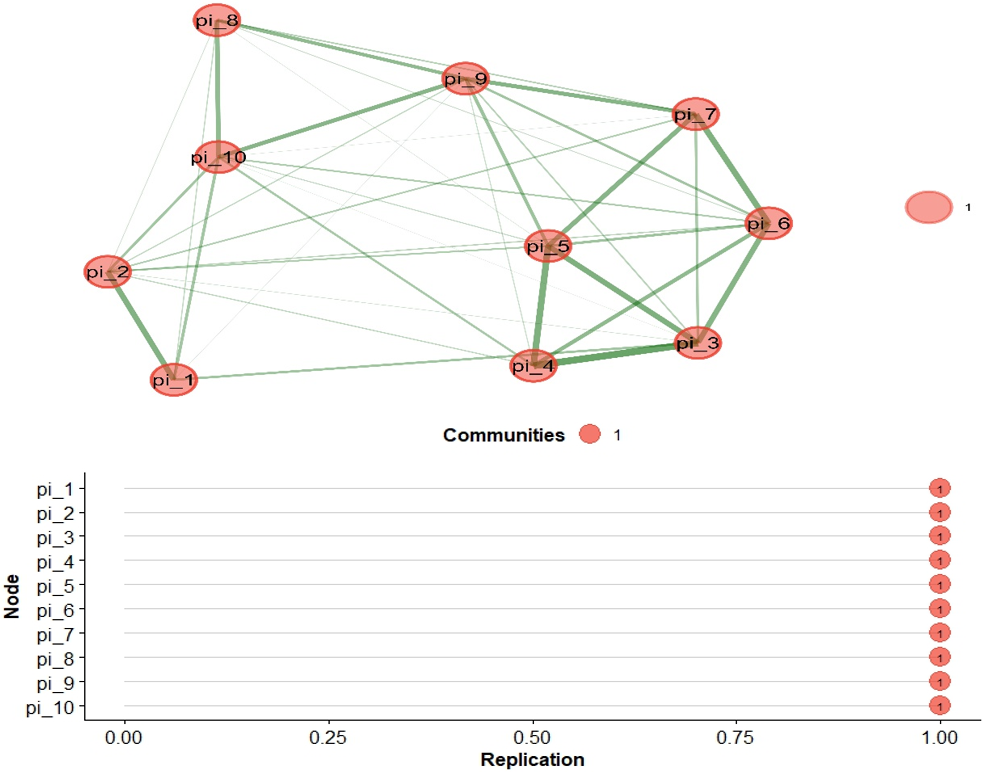
Figure 1. Internal structure and structural consistency of the network of the Attitudes toward Indigenous People Scale.
Figure 2 shows the comparison of the estimated networks for women (1) and men (2), evidencing a highly similar configuration of the relationships among items in both groups. Visually, an equivalent distribution of nodes and connectivity patterns is observed, which suggests structural stability of the network. This result was confirmed through the Membership Difference analysis, which indicated that no item showed statistically significant differences after Benjamini–Hochberg correction (p_BH > .05). Consequently, all items maintain their community assignment in both groups, evidencing that the dimensional structure of the network is completely invariant by sex.
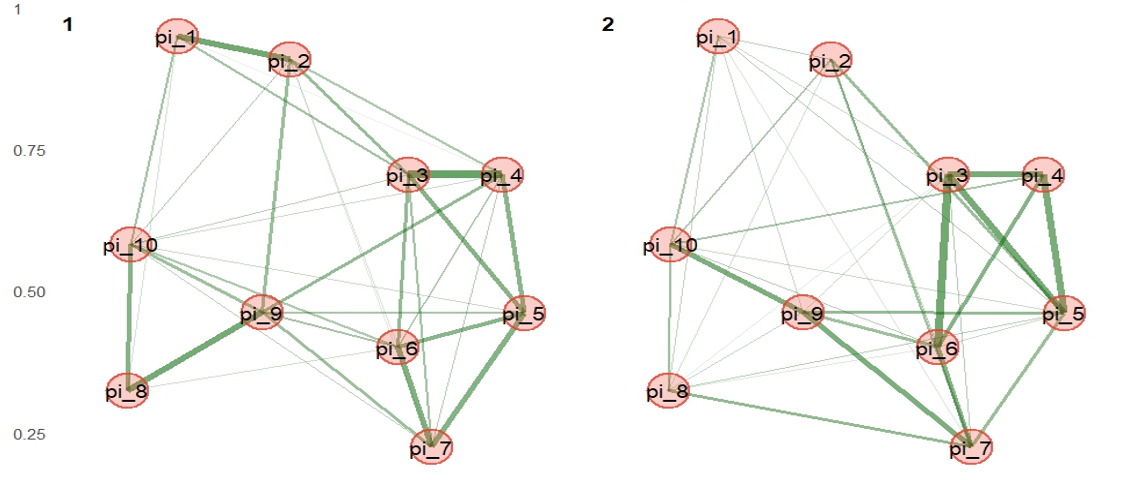
Figure 2. Psychometric network invariance by sex.
Confirmatory factor analysis (CFA) and factorial invariance across groups
In Table 3, the fit indices and reliability of the two confirmatory models evaluated are presented. The original two-dimensional model (M1) showed superior overall fit, with high incremental fit values (CFI = .976; TLI = .968), low residual error (SRMR = .032), and acceptable RMSEA (.082; 90% CI [.060, .104]). Likewise, both dimensions showed adequate levels of reliability and convergent validity (ω = .908 and .778; AVE = .592 and .541, respectively).
Table 3. Fit indices and reliability of the Confirmatory Model of the Attitudes toward Indigenous People Scale.
|
Model |
X2/gl |
CFI Robust |
TLI Robust |
SRMR |
RMSEA (IC 90%) Robust |
Dimensions (items) |
ω |
α |
AVE |
|
M1: original |
3.13 |
0.976 |
0.968 |
0.032 |
.082 (.060, .104) |
F1 = 1,2,3,4,5,6,7 |
0.91 |
0.91 |
0.59 |
|
|
|
|
|
|
|
F2 = 8,9,10 |
0.78 |
0.78 |
0.54 |
|
M2: network-based |
3.84 |
0.963 |
0.952 |
0.036 |
.100 (.080, .121) |
One-dimensional |
0.92 |
0.92 |
0.56 |
Note. CFI = Comparative Fit Index; TLI = Tucker–Lewis Index; RMSEA = Root Mean Square Error of Approximation; SRMR = Standardized Root Mean Square Residual; ω = McDonald’s omega; α = Cronbach’s alpha; AVE = Average Variance Extracted.
In turn, the unidimensional model derived from psychometric networks (M2) showed lower fit indices (CFI = .963; TLI = .952; RMSEA = .100; 90% CI [.080, .121]), although with adequate internal consistency (ω = .923; AVE = .558). However, the increase in approximation error and the reduction in fit indices indicate a less precise representation of the construct.
In Table 4, the factor loadings of the two-dimensional model (Model 1) show that the items present moderate to high associations with their respective factors (λ = .581 to .932 in F1 and λ = .667 to .901 in F2), which supports an adequate representation of the indicators in each dimension. However, the interfactor correlation is very high (r = .929), which suggests a significant overlap between Contact and stereotypes and Intolerance and inequity, indicating limited discriminant validity and collinearity between factors. In this context, the unidimensional model (Model 2) shows similarly moderate to high factor loadings (λ = .579 to .930), evidence of an adequate saturation of all items on a single factor. Overall, these results suggest that both factors may be reflecting a common underlying dimension; therefore, under criteria of parsimony and conceptual coherence, the acceptance of the unidimensional model as the most appropriate representation of the construct is supported.
Table 4. Standardized factor loadings of the Attitudes toward Indigenous People Scale.
|
Items |
M1: original |
M2: network-based |
|
|
|
F1 |
F2 |
One-dimensional |
|
pi_1 |
0.581 |
0.579 |
|
|
pi_2 |
0.725 |
0.722 |
|
|
pi_3 |
0.932 |
0.93 |
|
|
pi_4 |
0.908 |
0.907 |
|
|
pi_5 |
0.925 |
0.923 |
|
|
pi_6 |
0.91 |
0.907 |
|
|
pi_7 |
0.865 |
0.863 |
|
|
pi_8 |
0.667 |
0.641 |
|
|
pi_9 |
0.901 |
0.853 |
|
|
pi_10 |
|
0.814 |
0.779 |
|
Correlations |
|
||
|
F1: Contact and stereotypes |
- |
||
|
F2: Intolerance and inequity |
0.929 |
- |
|
Table 5 presents the results of the measurement invariance analysis by sex for the two confirmatory models evaluated. In the bidimensional model (M1), the configural model showed excellent fit (CFI = .996; TLI = .995; RMSEA = .030), confirming an equivalent factorial structure between women and men. Evaluation of the invariance levels showed that changes in fit indices were minimal (ΔCFI ≤ .005; ΔRMSEA ≤ .011; ΔSRMR ≤ .018), meeting the established criteria for accepting metric, scalar, and strict invariance.
Table 5. Measurement invariance of the Attitudes toward Indigenous People Scale by sex
|
|
|
X2 |
df |
RMSEA |
ΔRMSEA |
CFI |
ΔCFI |
SRMR |
ΔSRMR |
TLI |
ΔTLI |
|
Sex (M1) |
Configural |
103.382 |
68 |
0.030 |
- |
0.996 |
- |
0.038 |
- |
0.995 |
-- |
|
Metric |
104.145 |
76 |
0.041 |
0.011 |
0.992 |
0.004 |
0.056 |
0.018 |
0.990 |
0.005 |
|
|
Scalar |
120.155* |
84 |
0.044 |
0.003 |
0.990 |
0.002 |
0.060 |
0.004 |
0.989 |
0.001 |
|
|
Strict |
141.979** |
94 |
0.049 |
0.005 |
0.985 |
0.005 |
0.068 |
0.008 |
0.986 |
0.003 |
|
|
Sex (M2) |
Configural |
112.68 |
70 |
0.033 |
- |
0.995 |
-- |
0.042 |
- |
0.994 |
- |
|
Metric |
108.384 |
79 |
0.041 |
0.008 |
0.991 |
0.004 |
0.058 |
0.016 |
0.990 |
0.004 |
|
|
Scalar |
124.369* |
88 |
0.043 |
0.002 |
0.989 |
0.002 |
0.062 |
0.004 |
0.989 |
0.001 |
|
|
Strict |
148.708*** |
98 |
0.050 |
0.007 |
0.984 |
0.005 |
0.050 |
0.012 |
0.986 |
0.003 |
Note. χ² = chi-square; df = degrees of freedom; CFI = Comparative Fit Index; TLI = Tucker–Lewis Index; RMSEA = Root Mean Square Error of Approximation; SRMR = Standardized Root Mean Square Residual; ΔCFI = difference in Comparative Fit Index values; ΔTLI = difference in Tucker–Lewis Index values; ΔSRMR = difference in Standardized Root Mean Square Residual values; ΔRMSEA = difference in Root Mean Square Error of Approximation values. p < .05*, p < .01**, p < .001**.
Differential Item Functioning (DIF) analysis
Table 6 presents the differential item functioning by sex (0 = women; 1 = men) was evaluated using likelihood ratio tests (LRT) under the adjacent polytomous model, applying the Benjamini–Hochberg correction. The results evidenced uniform DIF in items pi_2 (BH-p = .041) and pi_3 (BH-p = .041), indicating that men tend to respond in a systematically more extreme manner than women on these items, not because they have greater actual prejudice, but because the item content activates a gender bias, while no non-uniform DIF was observed in any item. The remaining items showed invariant functioning (BH-p > .05), which supports the overall metric equivalence of the scale for sex comparisons.
Table 6. Differential Item Functioning (DIF) by sex.
|
Items |
Sex |
Conclusion |
|||
|
Uniform DIF |
Non-Uniform DIF |
|
|||
|
|
X2 |
BH-p |
X2 |
BH-p |
|
|
pi_1 |
0.294 |
0.685 |
2.023 |
0.387 |
Invariant |
|
pi_2 |
7.052 |
0.041 |
4.425 |
0.177 |
Uniform DIF |
|
pi_3 |
7.011 |
0.041 |
1.323 |
0.417 |
Uniform DIF |
|
pi_4 |
0.988 |
0.534 |
2.802 |
0.314 |
Invariant |
|
pi_5 |
0.078 |
0.780 |
0.572 |
0.522 |
Invariant |
|
pi_6 |
1.654 |
0.496 |
0.522 |
0.522 |
Invariant |
|
pi_7 |
1.009 |
0.534 |
5.595 |
0.177 |
Invariant |
|
pi_8 |
0.570 |
0.643 |
0.666 |
0.522 |
Invariant |
|
pi_9 |
2.285 |
0.436 |
0.068 |
0.794 |
Invariant |
|
pi_10 |
0.251 |
0.685 |
1.564 |
0.417 |
Invariant |
DISCUSSION
Attitudes toward Indigenous people constitute a central expression of socially naturalized prejudices that sustain practices of discrimination and symbolic hierarchization in the Peruvian context, manifesting through stereotypes, contact avoidance, intolerance, and unequal treatment (Pumacahua & Zeballos, 2022; Lovón Cueva & Palomino Gonzales, 2022; Celigueta & Viola, 2021; Viola Recasens, 2020; de Veintimilla, 2024). From this perspective, the present study aimed to conduct the first comprehensive psychometric evaluation of the Attitudes toward Indigenous People Scale, using a university sample and integrating network-based exploratory analysis, confirmatory factor analysis, multigroup invariance assessment, and differential item functioning. The results supported the original bidimensional model, based on the evaluation of the quality of the measurement system and its equivalence between men and women, providing empirical evidence on the functioning of the instrument in a sociocultural context characterized by the persistence of prejudice toward the Indigenous population.
Regarding the internal structure of the instrument, the results obtained through psychometric networks and confirmatory analysis coincide in evidencing a high interrelation among all items. EGA suggested the grouping of items into a single stable community, which could initially be interpreted as a unidimensional organization (Golino & Christensen, 2025; Christensen, 2020). CFA showed that the original two-dimensional model (M1), although it presents superior fit in terms of incremental indices and lower approximation error, also shows a high overlap between factors, which limits its discriminant validity and suggests the presence of a common underlying dimension. In this sense, under criteria of parsimony, the two-dimensional model was rejected and the unidimensional model derived from the network analysis was accepted, which showed adequate factor loadings and satisfactory goodness-of-fit indices (Brown, 2015; Kline, 2015; Pavlov et al., 2021). In this way, a convergence between the results of CFA and psychometric networks is observed, as both approaches support the existence of a single latent dimension that explains the behavior of the items. This decision is based on the fact that, although the original dimensions capture differentiated conceptual nuances, empirically they do not behave as independent constructs, but rather as manifestations of the same attitudinal continuum toward Indigenous people.
Regarding the psychometric performance of the instrument, the obtained indicators support reliable measurement with evidence of convergent validity. Both dimensions of the bidimensional model showed adequate internal consistency, with omega coefficients (McDonald, 1999; Hayes & Coutts, 2020), together with Average Variance Extracted values above the recommended threshold (Fornell & Larcker, 1981). Standardized factor loadings were above the recommended threshold, indicating a substantive contribution of the items to their corresponding factors (Johnson & Stevens, 2001). These results are consistent with the low global redundancy observed in the network analysis and with the complete structural stability identified through Bootstrap EGA, suggesting that the items provide differentiated information without problematic overlap and form a stable measurement structure (Christensen et al., 2023; Christensen & Golino, 2021; Golino & Christensen, 2025). Taken together, the convergence of internal consistency, convergent validity, low redundancy, and structural stability supports the psychometric quality of the scale and suggests that the instrument offers a brief but psychometrically solid assessment of attitudes toward Indigenous people in a university population.
Regarding sex invariance evaluated through multigroup SEM, the results evidenced configural, metric, scalar, and strict invariance, indicating that the factorial structure, loadings, intercepts, and measurement errors are equivalent between women and men (Vandenberg & Lance, 2000; Chen, 2007; Putnick & Bornstein, 2016). This evidence indicates measurement equivalence by sex.
The results of the DIF analysis evidenced the presence of uniform DIF in items pi₂ (“Indigenous people do not behave appropriately in public spaces”) and pi₃ (“I would feel uncomfortable being seen in public with Indigenous friends”), indicating that, at equal levels of the latent trait, men and women systematically differ in the probability of selecting certain response options on these items, which is consistent with the operational definition of differential item functioning as systematic variation not attributable to the level of the measured construct (Zumbo, 1999). This pattern does not necessarily reflect real differences in the level of the evaluated construct (attitudes toward Indigenous people) between sexes, but rather appears to be associated with the semantic content of the items, which may induce differentiated responses, a phenomenon that can be identified using polytomous IRT models for DIF detection (Magis et al., 2010).
Both items share specific semantic elements, such as “in public,” “behave appropriately,” and “that they would see me,” which introduce components of social evaluation and self-image, which are embedded in a network of socially naturalized prejudices and hierarchical schemes that regulate everyday interactions in the Peruvian context (Celigueta & Viola, 2021; Lovón Cueva & Palomino Gonzales, 2022; Pumacahua & Zeballos, 2022). This type of wording may lead respondents to answer considering what is socially accepted, status, or public exposure, dimensions that are part of learned social habits and practices, often without explicit awareness, and which tend to be differentially modulated by gender roles in Latin America (de Veintimilla, 2024; Lovón Cueva & Palomino Gonzales, 2022). Consequently, it is expected that men and women respond differently to items that involve social visibility, which is consistent with the observed pattern of uniform DIF, characterized by constant shifts in the item characteristic curves without changes in their slopes, a typical feature of uniform DIF and of local biases associated with item content rather than structural differences in the construct (Millsap, 2011).
This finding indicates that items pi₂ and pi₃ do not exclusively measure attitudes toward Indigenous people, but partially capture normative components linked to gender, introducing systematic bias by sex. Nevertheless, given that measurement is globally invariant and that DIF is restricted to two items, the instrument maintains overall validity for intergroup comparisons (Millsap, 2011; Zumbo, 1999). In this sense, both approaches, multigroup SEM, psychometric networks, and IRT-DIF, confirm that the Attitudes toward Indigenous People Scale confirms global invariance, with localized bias in the items. Therefore, it is recommended that future studies explore semantically more neutral reformulations of these items, aimed at reducing the activation of components of social evaluation and public visibility, thus strengthening the measurement equity of the instrument (Millsap, 2011; Zumbo, 1999).
Implications
From a methodological perspective, the results support the use of the Attitudes toward Indigenous People Scale as a brief and psychometrically adequate measure in a university population, by evidencing a stable unidimensional structure and measurement equivalence by sex. Likewise, the identification of localized semantic biases highlights the importance of reviewing items that activate normative or social visibility components, even when measurement is globally invariant.
From a social determinant of health perspective (Braveman et al., 2011), negative attitudes toward Indigenous people reflect persistent forms of exclusion and social hierarchization that shape unequal environments. Discrimination constitutes a structural factor that limits equitable access to social, educational, and health resources, and may influence the quality of care provided by medical and psychological services, contributing to the reproduction of health inequities (Braveman et al., 2011; World Health Organization [WHO], 2008). In this sense, having a validated instrument makes it possible to identify adverse social climates in university contexts and to support studies aimed at understanding how these dynamics of prejudice are articulated with broader processes of social inequality and health vulnerability.
From a mental health perspective, sustained exposure to stereotypes, contact avoidance, and intolerance is linked to higher levels of stress, emotional distress, and deterioration of subjective well-being in affected populations. Everyday discrimination can operate as a chronic stressor, increasing vulnerability to symptoms of anxiety, depression, and social withdrawal. Within this framework, the scale offers a useful tool to investigate the relationship between prejudicial attitudes and mental health in young people, as well as to evaluate the impact of educational interventions aimed at promoting inclusion. Its application can contribute to preventive approaches by allowing the identification of psychosocial risk contexts associated with discriminatory social climates.
Limitations and recommendations
Among the main limitations of the study is the use of a non-probabilistic university sample, which restricts the generalization of the results to other age groups and sociocultural contexts. It is also acknowledged the possible presence of social desirability bias in the responses, derived from the sensitive nature of the evaluated content, and that the use of a self-report instrument may introduce biases associated with the subjective perception of the participants.
Likewise, the cross-sectional design prevents establishing causal relationships between the evaluated attitudes and possible associated variables. Although the scale showed global measurement equivalence by sex, the presence of localized DIF in two items suggests the need to continue refining the semantic content of some items; additionally, it is suggested that future research consider effect size to assess the impact of DIF. more precisely Furthermore, the boundary value of RMSEA was not discussed in depth, which restricts the interpretation of model fit in terms of approximation error.
Based on this, it is recommended to replicate the validation of the instrument in more diverse samples, including non-university populations and intercultural contexts, as well as to explore semantically more neutral versions of the items with localized bias. Future studies could also examine the relationship between attitudes toward Indigenous people and mental health, well-being, and social climate variables, strengthening the use of the instrument in applied research and in the evaluation of interventions aimed at reducing prejudice.
ORCID
Julio Cesar Huamani-Cahua: https://orcid.org/0000-0001-8159-803X
Yuliana Ordoño Ticona: https://orcid.org/0009-0008-4362-7491
Miriam Yisela Viamonte Quispe: https://orcid.org/0009-0005-3487-3904
Nanyery Belén Vega Carpio: https://orcid.org/0009-0002-4161-7712
Estefany Cecilia Ojeda-Flores: https://orcid.org/0009-0006-2367-8553
AUTHORS’ CONTRIBUTION
Julio Cesar Huamani-Cahua: Conceptualization, Methodology, Software, Validation, Formal analysis, and Data Curation.
Yuliana Ordoño Ticona: Conceptualization, Validation.
Miriam Yisela Viamonte Quispe: Methodology, Review & Editing
Nanyery Belén Vega Carpio: Data Curation, Project administration
Estefany Cecilia Ojeda-Flores: Conceptualization, Investigation, Writing - Original Draft and Supervision.
FUNDING SOURCE
This study did not receive any funding.
CONFLICT OF INTEREST
The authors declare that there were no conflicts of interest during data collection, data analysis, or manuscript preparation.
ACKNOWLEDGMENTS
Not applicable.
REVIEW PROCESS
This study was reviewed by Eduardo Cárcamo-Zepeda and Leonardo Andrés Aguilar through a double-blind process. The editor in charge was David Villarreal-Zegarra. The review process is included as supplementary material 1.
DATA AVAILABILITY STATEMENT
The data that support the findings of the study are available on request from the corresponding author, due to ethical and privacy restrictions. Additionally, the R code used for the analyses has been included as supplementary material, to ensure the reproducibility of the study.
DECLARATION OF THE USE OF GENERATIVE ARTIFICIAL INTELLIGENCE
Generative artificial intelligence tools were used in a limited manner to support the drafting and linguistic revision of the manuscript. The study design, data analysis, interpretation of the results, and conclusions are the sole responsibility of the authors.
DISCLAIMER
The authors are responsible for all statements made in this article.
REFERENCES
Alcota, P., & Rebolledo-Huenuil, D. (2025). Racismo hacia pueblos originarios en Latinoamérica: metasíntesis. Portal de la Ciencia, 6(3), 485-499. https://doi.org/10.51247/pdlc.v6i3.629.
Arifin, W. N. (2025). Sample size calculator (web). Retrieved fromhttp://wnarifin.github.io
Ato, M., López, JJ, & Benavente, A. (2013). A classification system for research designs in psychology. Annals of Psychology, 29(3), 1038–1059. https://doi.org/10.6018/analesps.29.3.178511
Benjamini, Y., & Hochberg, Y. (1995). Controlling the false discovery rate: A practical and powerful approach to multiple testing. Journal of the Royal Statistical Society: Series B (Methodological), 57(1), 289–300. https://doi.org/10.1111/j.2517-6161.1995.tb02031.x
Braveman, P., Egerter, S., & Williams, D. R. (2011). The social determinants of health: coming of age. Annual review of public health, 32(1), 381-398. https://doi.org/10.1146/annurev-publhealth-031210-101218
Brown, T. A. (2015). Confirmatory factor analysis for applied research (2nd ed.). Guilford Press.
Cárdenas, M. (2007). Escala de racismo moderno: propiedades psicométricas y su relación con variables psicosociales. Universitas psychologica, 6(2), 255-262. https://revistas.javeriana.edu.co/index.php/revPsycho/article/download/114/99
Celigueta, G., & Viola, A. (2021). Pantallas y prejuicios: estereotipos mediáticos sobre las mujeres indígenas en Perú y Guatemala. Disparidades. Revista de Antropología, 76(2), e015b-e015b. https://doi.org/10.3989/dra.2021.015b
Chen, F. F. (2007). Sensitivity of Goodness of Fit Indices to Lack of Measurement Invariance. Structural Equation Modeling: A Multidisciplinary Journal, 14(3), 464–504. https://doi.org/10.1080/10705510701301834
Christensen, A. P. (2020). Towards a network psychometrics approach to assessment: Simulations for redundancy, dimensionality, and loadings [Unpublished doctoral dissertation]. University of North Carolina at Greensboro. https://doi.org/10.31234/osf.io/84kgd
Christensen, A.P., & Golino, H. (2021). Estimating the Stability of Psychological Dimensions via Bootstrap Exploratory Graph Analysis: A Monte Carlo Simulation and Tutorial. Psych, 3(3), 479-500. https://doi.org/10.3390/psych3030032
Christensen, AP, Garrido, LE, & Golino, H. (2023). Unique variable analysis: A network psychometrics method to detect local dependence. Multivariate Behavioral Research, 58(6), 1165-1182. https://doi.org/10.1080/00273171.2023.2194606
Comisión Económica para América Latina y el Caribe [CEPAL]. (2016). La matriz de la desigualdad social en América Latina. Naciones Unidas. https://n9.cl/eptl
de Veintimilla, A. M. (2024). Racismo institucional en la salud: Claves para pensar la atención en salud desde la interculturalidad. Ecuador Debate, 121, 77–102. https://caapecuador.org/ ecuador-debate-n-121/
Echeverría Echeverría, R., & Flores Galaz, M. M. (2013). Diseño y validación de una escala de creencias estereotípicas hacia personas indígenas. Revista De Psicología, 31(2), 349–370. https://doi.org/10.18800/psico.201302.007
Epskamp, S., Borsboom, D., & Fried, E.I. (2018). Estimating psychological networks and their accuracy: A tutorial. Behavior Research Methods, 50(1), 195–212. https://doi.org/10.3758/s13428-017-0862-1
Fornell, C., & Larcker, D.F. (1981). Evaluating structural equation models with unobservable variables and measurement error. Journal of Marketing Research, 18(1), 39–50. https://doi.org/10.1177/002224378101800104
Foygel, R., & Drton, M. (2010). Extended Bayesian information criteria for Gaussian graphical models. In Advances in Neural Information Processing Systems 23: 24th Annual Conference on Neural Information Processing Systems 2010, NIPS 2010. Neural Information Processing Systems. https://proceedings.neurips.cc/paper_files/paper/2010/file/072b030ba126b2f4b2374f342be9ed44-Paper.pdf
Golino, H., & Christensen, A.P. (2025). EGAnet: Exploratory Graph Analysis – A framework for estimating the number of dimensions in multivariate data using network psychometrics. https://doi.org/10.32614/CRAN.package.EGAnet
Golino, H., Shi, D., Christensen, A. P., Garrido, L. E., Nieto, M. D., Sadana, R., Thiyagarajan, J. A., & Martinez-Molina, A. (2020). Investigating the performance of exploratory graph analysis and traditional techniques to identify the number of latent factors: A simulation and tutorial. Psychological Methods, 25(3), 292–320. https://doi.org/10.1037/met0000255
González Fócil, R. C. (2016). Escala de actitudes hacia personas indígenas. En B. E. García y García, M. M. Lozano Álvarez, & I. F. Díaz Oropeza (Comps.), 19 escalas de evaluación psicológica (pp. 36–42). Universidad de las Américas, A. C.
Hayes, A.F., & Coutts, J.J. (2020). Use Omega Rather than Cronbach's Alpha for Estimating Reliability. But…. Communication Methods and Measures, 14(1), 1–24. https://doi.org/10.1080/19312458.2020.1718629
Instituto Nacional de Defensa de la Competencia y de la Protección de la Propiedad Intelectual [Indecopi]. (2015). Discriminación en el consumo y trato diferenciado ilícito en la jurisprudencia del Indecopi. http://hdl.handle.net/11724/4973
Isvoranu, A.M., & Epskamp, S. (2023). Which estimation method to choose in network psychometrics? Deriving guidelines for applied researchers. Psychological methods, 28(4), 925–946. https://doi.org/10.1037/met0000439
Jamison, L., Christensen, A.P., & Golino, H.F. (2024). Metric invariance in exploratory graph analysis via permutation testing. Methodology, 20(2), 144-186. https://doi.org/10.5964/meth.12877
Johnson, B., & Stevens, J.J. (2001). Exploratory and confirmatory factor analysis of the School Level Environment Questionnaire (SLEQ). Learning Environments Research, 4(3), 325-344. https://doi.org/10.1023/A:1014486821714
Kline, R. B. (2015). Principles and practice of structural equation modeling (4th ed.). The Guilford Press.
Li, C. H. (2016). Confirmatory factor analysis with ordinal data: Comparing robust maximum likelihood and diagonally weighted least squares. Behavior research methods, 48(3), 936–49. https://doi.org/10.3758/s13428-015-0619-7
Lovón Cueva, M. A., & Palomino Gonzales, M. M. (2022). Discriminación y racismo en tiempo de coronavirus: El discurso de la desigualdad social de la ‘pituquería’en el Perú. Lengua y Sociedad, 21(1), 163-203. https://dialnet.unirioja.es/servlet/articulo?codigo=9226281
Magis, D., Béland, S., Tuerlinckx, F., & De Boeck, P. (2010). A general framework and an R package for the detection of dichotomous differential item functioning. Behavior research methods, 42(3), 847–862. https://doi.org/10.3758/BRM.42.3.847
McConahay, J. B., Hardee, B. B. & Batss, V. (1981). Has Racism Declined in America? It Depends upon Who Is Asking and What Is Asked. Journal of Conflict Resolution, 25(4), 563-579. https://doi.org/10.1177/002200278102500401
McDonald, R. P. (1999). Test Theory: A Unified Treatment (1st ed.). Psychology Press. https://doi.org/10.4324/9781410601087
Merino-Soto, C. & Livia-Segovia, J. (2009). Intervalos de confianza asimétricos para el índice la validez de contenido: Un programa Visual Basic para la V de Aiken [Confidence intervals for the content validity: A Visual Basic computer program for the Aiken's V]. Anales de Psicología, 25(1), 169–171. https://psycnet.apa.org/record/2009-08527-019
Millsap, R. E. (2011). Statistical approaches to measurement invariance. Routledge. https://doi.org/10.4324/9780203821961
Ministerio de Cultura (Perú). (2018). I Encuesta Nacional: Percepciones y actitudes sobre diversidad cultural y discriminación étnico-racial (Ipsos Peru). https://centroderecursos.cultura.pe/es/registrobibliografico/i-encuesta-nacional-percepciones-y-actitudes-sobre-diversidad-cultural-y-discriminacion-etnico-racial
Pavlov, G., Maydeu-Olivares, A., & Shi, D. (2021). Using the Standardized Root Mean Squared Residual (SRMR) to Assess Exact Fit in Structural Equation Models. Educational and psychological measurement, 81(1), 110–130. https://doi.org/10.1177/0013164420926231
Pedersen, A., Beven, J., Walker, I., & Griffiths, B. (2004). Attitudes toward Indigenous Australians: The role of empathy and guilt. Journal of Community & Applied Social Psychology, 14(4), 233–249. https://doi.org/10.1002/casp.771
Pettigrew, T. F., & Meertens, R. W. (1995). Subtle and blatant prejudice in Western Europe. European Journal of Social Psychology, 25(1), 57–75. https://doi.org/10.1002/ejsp.2420250106
Posit team (2023). RStudio: Integrated Development Environment for R. Posit Software, PBC, Boston, MA. URL http://www.posit.co/.
Pumacahua, M. C., & Zeballos, P. E. (2022). Prejuicios lingüísticos de los estudiantes peruanos bilingües universitarios hacia el quechua. Diálogo Andino, (67), 183-193. http://dx.doi.org/10.4067/S0719-26812022000100183
Putnick, D.L., & Bornstein, M.H. (2016). Measurement invariance conventions and reporting: The state of the art and future directions for psychological research. Developmental Review, 41, 71–90. https://doi.org/10.1016/j.dr.2016.06.004
Romero, F. C. (2022). Valoración de la cultura indígena en el Perú. Llalliq, 2(2), 208-215. https://doi.org/10.32911/llalliq.2022.v2.n2.966
The jamovi project. (2024). jamovi (Version 2.4) [Computer software]. https://www.jamovi.org
Traag, V. A., Waltman, L., & van Eck, N. J. (2019). From Louvain to Leiden: Guaranteeing well-connected communities. Scientific Reports, 9, Article 5233. https://doi.org/10.1038/s41598-019-41695-z
Vandenberg, R. J., & Lance, C. E. (2000). A review and synthesis of the measurement invariance literature: Suggestions, practices, and recommendations for organizational research. Organizational Research Methods, 3(1), 4–70. https://doi.org/10.1177/109442810031002
Viola Recasens, A. (2020). Andinofobia en prime time: La paisana Jacinta y el linchamiento televisivo de las mujeres andinas en Perú. En G. Orobitg Canal (Coord.), Medios indígenas: teorías y experiencias de la comunicación indígena en América Latina (pp. 371–409). Edicions Bellaterra. doi.org/10.31819/9783968691084_013
World Health Organization [WHO]. (2008). Closing the gap in a generation: Health equity through action on the social determinants of health. World Health Organization. https://www.who.int/publications/i/item/9789241563703
Zumbo, B. D. (1999). A handbook on the theory and methods of differential item functioning (DIF): Logistic regression modeling as a unitary framework for binary and Likert-type (ordinal) item scores. Directorate of Human Resources Research and Evaluation, Department of National Defense. https://faculty.educ.ubc.ca/zumbo/DIF/handbook.pdf
TOWARD INDIGENOUS PEOPLE SCALE
INSTRUCTIONS:
Below are statements referring to experiences related to Indigenous people. Please indicate your level of agreement with each statement on a scale ranging from 1 to 5.
1: Totally disagree
2: Disagree
3: Neutral (Neither agree nor disagree)
4: Agree
5: Totally agree
|
STATEMENTS: |
1 |
2 |
3 |
4 |
5 |
|
1. If I could choose, I would prefer to interact with or study with people who are not Indigenous. |
|
|
|
|
|
|
2. Indigenous people do not behave appropriately in public spaces.. |
|
|
|
|
|
|
3. I would feel uncomfortable being seen in public with Indigenous friends. |
|
|
|
|
|
|
4. I prefer to avoid physical contact (shaking hands) with Indigenous people. |
|
|
|
|
|
|
5. The presence of Indigenous people gives the city a bad impression. |
|
|
|
|
|
|
6. Indigenous people are less capable than other cultural groups. |
|
|
|
|
|
|
7. Indigenous people are disadvantaged because they do not make enough effort |
|
|
|
|
|
|
8. Indigenous people tend to be overly trusting and treat others with excessive familiarity. |
|
|
|
|
|
|
9. Indigenous people should not attend places where they already know they are not welcome. |
|
|
|
|
|
|
10. Indigenous people demand special treatment that they do not deserve. |
|
|
|
|
|